
Drilling & Completions | Third Quarter (3Q) Update | Capital Markets | Capital Expenditure
Matador, LOE down -25%, More Cut to FY Capex; Well Count

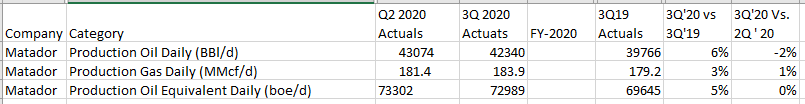
- Oil Production was up +6% year over year, but fell 2% sequentially.
- Equivalent production was up +5% year over year, but flat sequentially.
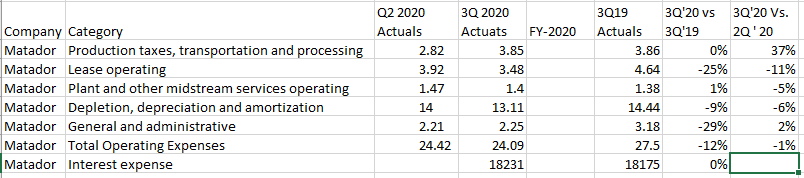
- LOE was down 25% vs last year and 11% sequentially.
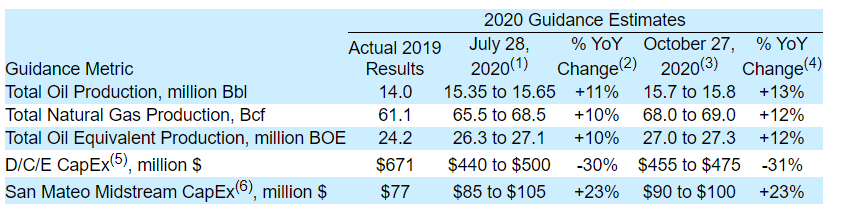
- Cut full year Capex by another $30 million (now down -31% vs 2019)
- Even though the company has cut capex, the well count stays the same.
New Full Year Gudiance
Significant Well Results
The following table highlights the 24-hour initial potential ("IP") test results from the 13 Boros wells in the Stateline asset area in southeastern Eddy County, New Mexico, all of which are two-mile laterals. All 13 wells were completed and turned to sales at varying times during September 2020. Matador acquired the 2,800 gross and net acres comprising its Stateline asset area as part of the September 2018 Bureau of Land Management lease sale, and the 13 Boros wells were all drilled and completed on the eastern portion of this leasehold. The 24-hour IP test results from the first four Boros wells completed and turned to sales were previously reported in a separate press release on September 22, 2020, but all 13 wells are summarized below for completeness.
|
Completion |
24-hr IP |
BOE/d / |
Oil |
||||||||
|
Asset Area/Well Name |
Interval |
(BOE/d) |
1,000 ft.(1) |
(%) |
Comments |
||||||
|
Stateline, Eddy County, NM |
|||||||||||
|
Boros #104H |
Avalon |
2,423 |
241 |
65% |
Tested 1,573 Bbl of oil per day and 5.1 MMcf of natural gas per day. |
||||||
|
Boros #123H |
Second Bone Spring |
3,160 |
310 |
68% |
Tested 2,150 Bbl of oil per day and 6.1 MMcf of natural gas per day. |
||||||
|
Boros #124H |
Second Bone Spring |
3,329 |
331 |
71% |
Tested 2,368 Bbl of oil per day and 5.8 MMcf of natural gas per day. |
||||||
|
Boros #201H |
Wolfcamp A-XY |
3,147 |
323 |
60% |
Tested 1,874 Bbl of oil per day and 7.6 MMcf of natural gas per day. |
||||||
|
Boros #202H |
Wolfcamp A-XY |
3,128 |
318 |
62% |
Tested 1,953 Bbl of oil per day and 7.0 MMcf of natural gas per day. |
||||||
|
Boros #203H |
Wolfcamp A-XY |
3,668 |
375 |
59% |
Tested 2,146 Bbl of oil per day and 9.1 MMcf of natural gas per day. |
||||||
|
Boros #204H |
Wolfcamp A-XY |
3,227 |
330 |
58% |
Tested 1,878 Bbl of oil per day and 8.1 MMcf of natural gas per day. |
||||||
|
Boros #215H |
Wolfcamp A-Lower |
4,600 |
461 |
60% |
Tested 2,750 Bbl of oil per day and 11.1 MMcf of natural gas per day. |
||||||
|
Boros #216H |
Wolfcamp A-Lower |
3,569 |
357 |
59% |
Tested 2,113 Bbl of oil per day and 8.7 MMcf of natural gas per day. |
||||||
|
Boros #217H |
Wolfcamp A-Lower |
3,806 |
384 |
54% |
Tested 2,060 Bbl of oil per day and 10.5 MMcf of natural gas per day. |
||||||
|
Boros #218H |
Wolfcamp A-Lower |
4,496 |
462 |
55% |
Tested 2,473 Bbl of oil per day and 12.1 MMcf of natural gas per day. |
||||||
|
Boros #223H |
Wolfcamp B-Lower |
3,257 |
326 |
19% |
Tested 618 Bbl of oil per day and 15.8 MMcf of natural gas per day. |
||||||
|
Boros #224H |
Wolfcamp B-Upper |
3,415 |
342 |
37% |
Tested 1,249 Bbl of oil per day and 13.0 MMcf of natural gas per day. |
||||||
|
TOTAL/AVERAGE |
45,225 |
350 |
56% |
Tested 25,205 Bbl of oil per day and 120.0 MMcf of natural gas per day. |
|||||||
|
(1) 24-hour IP per 1,000 feet of completed lateral length. |
|||||||||||
Matador is extremely pleased with the various 24-hour IP test results from six different intervals in the Boros wells. The IP test results from the Boros #123H and #124H wells are the top two IP test results that Matador has reported to date for wells completed and turned to sales in the Second Bone Spring formation throughout the Delaware Basin. Similarly, the IP test results from the Boros #215H, #216H and #217H wells are three of the top four IP test results that Matador has achieved to date for wells completed and turned to sales in the Wolfcamp A-Lower formation. In addition, most of these 24-hour IP test results were recorded at very high flowing casing pressures of between 3,000 and 4,200 pounds per square inch ("psi") in the Wolfcamp A-XY, Wolfcamp A-Lower and Wolfcamp B formations, further indicating the strong productivity of these wells. All 13 Boros wells highlighted in this release are currently producing at restricted flow rates (well below the test rates noted in the table above) through Matador's newly constructed production facilities in the Stateline asset area. All oil, natural gas and water from these wells has been gathered via San Mateo's infrastructure since the wells were initially turned to sales.
ORIGINAL PRESS RELEASE
Third Quarter 2020 Management Summary Comments
Joseph Wm. Foran, Matador's Chairman and CEO, commented, "On both our website and for the webcast planned for tomorrow's earnings conference call is a set of five slides identified as `Chairman's Remarks' (Slides A through E) to add color and detail to my remarks. We invite you to review these slides in conjunction with my comments below, which are intended to provide context for the quarter compared to Matador's goals for the year.
"Matador completed and turned to sales earlier this year the first six Rodney Robinson wells in the western portion of our Antelope Ridge asset area and the first five Ray wells in our Rustler Breaks asset area, all of which were two-mile laterals. Turning these wells to production represented the first two of five operational `milestones' that Matador identified as essential to our success in 2020, as noted in Slide A. These wells have all continued to perform above expectations. The Rodney Robinson wells have produced in aggregate approximately 2.1 million BOE in just over six months of production, and the Ray wells have produced in aggregate approximately 1.2 million BOE in approximately five months of production.
"The third quarter of 2020 was another positive quarter for Matador, highlighted by the completion of three more significant and long-anticipated operational milestones. First, Matador completed and turned to sales the first 13 Boros wells in our Stateline asset area in southeastern Eddy County, New Mexico with better-than-anticipated results and lower-than-estimated capital expenditures. Second, San Mateo, our midstream affiliate, completed and placed in service an expansion of the Black River Processing Plant and approximately 43 miles of large-diameter natural gas and oil pipelines in Eddy County, both on time and on budget. The successful completion of these two significant projects reflects the vision, execution and determination of the Matador and San Mateo teams to achieve the goals Matador set as part of the Bureau of Land Management lease acquisition two years ago in terms of improved capital efficiency, production and reserves growth and midstream expansion (see Slide A). Third, over the summer, Matador also successfully completed the fifth and the final of its operational milestones when we turned to sales the five Leatherneck wells in the Greater Stebbins Area. Today, the oil, natural gas and water production from both the Stateline asset area and the Greater Stebbins Area, as well as the Wolf and Rustler Breaks asset areas, is being gathered by San Mateo via its 335 miles of midstream pipeline infrastructure. As a result of these accomplishments, we expect Matador's oil, natural gas and total production and San Mateo's revenues to reach record levels during the fourth quarter of 2020.
"The Board and I would like to congratulate and commend the Matador and San Mateo teams for their strong execution and professionalism to complete these operational milestones as planned. Despite the recent challenges of the novel coronavirus and the abrupt decline in oil prices experienced since early March, the Matador and San Mateo teams have kept their `eyes on the ball.' In doing so, they have delivered multiple important projects in 2020 that are providing significant value for Matador and its stakeholders.
"Consistent with our revised plans for 2020 as provided in early March, we operated three drilling rigs during the third quarter, and we continued to achieve record-low unit operating expenses and drilling and completion costs per lateral foot. As a consequence of our increasing production and various cost reductions, our ability to be free cash flow positive is clearly in sight. In fact, we fully expect to generate free cash flow in the fourth quarter of 2020 and in 2021 at current strip prices for oil and natural gas (see Slide B).
"During the third quarter of 2020, our operations team once again led the way in our ongoing efforts to improve capital efficiency and operating costs, achieving better-than-anticipated capital expenditures and operating expenses. Drilling and completion costs for all operated horizontal wells completed and turned to sales in the third quarter of 2020 averaged $790 per completed lateral foot, an all-time low for Matador (see Slide C). Operating expenses in the third quarter of 2020 were also at or near all-time lows for Matador. Lease operating expenses on a unit-of-production basis declined 11% sequentially to $3.48 per BOE in the third quarter, an all-time low for Matador, resulting primarily from our continued efforts to reduce costs in the field, including 98% of our produced water now being gathered via pipeline. General and administrative expenses on a unit-of-production basis were $2.25 per BOE in the third quarter, similar to Matador's all-time low of $2.21 per BOE achieved in the second quarter of 2020, as the salary and other cost reductions voluntarily implemented early in 2020 continued to be realized in the third quarter (see Slide D).
"Financially, we continued to protect our balance sheet and liquidity and ended the third quarter of 2020 with outstanding borrowings under our reserves-based credit facility that were $25 million less than anticipated and a leverage ratio of 2.8x, which was also below our expectations and still well below our reserves-based loan covenant of 4.0x (see Slide B). Further, we are pleased to report that late last week, as part of the fall 2020 redetermination process, Matador's lenders reaffirmed the Company's borrowing base under its reserves-based credit facility at $900 million. Matador's elected commitment under the credit facility also remained constant at $700 million, and there were no changes made to the terms of the credit facility. The entire Matador team extends its thanks to our lending group for their continued support, and we look forward to reducing the borrowings outstanding under our reserves-based credit facility as we begin to generate free cash flow in the fourth quarter of 2020 and beyond.
"Finally, we are pleased to announce that effective as of October 1, 2020, Matador and its joint venture partner, Five Point Energy LLC, completed the successful merger of San Mateo I and San Mateo II into a single entity, San Mateo Midstream, LLC. The Matador, Five Point and San Mateo teams are pleased to complete the merger and the San Mateo expansion projects noted above. With the merger completed, we now look forward to the ongoing free cash flow that San Mateo should generate in future periods and to continuing to attract new customers to San Mateo's premier three-pipe midstream offering in Eddy County, New Mexico.
"Having achieved the completion of these significant projects and the third quarter 2020 operating and financial results summarized throughout this release, the Board, the staff and I believe that Matador has reached an important and positive inflection point (see Slide E). We plan to continue our strategy of growing our exploration and production and midstream businesses in tandem and remain confident the outlook for Matador is very bright. And, as I often say, we like our chances very much going forward."
Financial and Operational Highlights
Oil, Natural Gas and Oil Equivalent Production
As summarized in the table below, Matador's third quarter 2020 average daily oil, natural gas and total oil equivalent production all exceeded expectations. The majority of the production outperformance resulted from stronger-than-expected initial results from the 13 Boros wells in the Stateline asset area that were turned to sales in September 2020, as well as positive results from other wells completed and turned to sales during the third quarter.
|
Production Change (%) |
|||||
|
Production |
Q3 Average Daily Volume |
Sequential(1) |
Guidance(2) |
Difference(3) |
YoY(4) |
|
Total, BOE per day |
73,000 |
- |
(5%) to (6%) |
+5.5% |
+5% |
|
Oil, Bbl per day |
42,300 |
(2%) |
(5%) to (7%) |
+4.0% |
+6% |
|
Natural Gas, MMcf per day |
183.9 |
+1% |
(4%) to (6%) |
+6.0% |
+3% |
|
(1) As compared to the second quarter of 2020. |
|||||
|
(2) Production change previously projected, as provided on July 28, 2020. |
|||||
|
(3) As compared to midpoint of guidance provided on July 28, 2020. |
|||||
|
(4) Represents year-over-year percentage change from the third quarter of 2019. |
|||||
Net Income, Earnings Per Share and Adjusted EBITDA
- Third quarter 2020 net loss (GAAP basis) was $276.1 million, or a net loss of $2.38 per diluted common share, an improvement from a net loss of $353.4 million in the second quarter of 2020, and a year-over-year decrease from net income of $44.0 million in the third quarter of 2019. The third quarter 2020 net loss (GAAP basis) was primarily attributable to a non-cash full-cost ceiling impairment of $251.2 million recorded in the third quarter, resulting primarily from the recent sharp declines in oil prices as compared to the prior periods. The changes in net (loss) income between periods was also impacted by a non-cash, unrealized loss on derivatives of $13.0 million in the third quarter of 2020, as compared to a non-cash, unrealized loss on derivatives of $132.7 million in the second quarter of 2020 and a non-cash, unrealized gain on derivatives of $9.8 million in the third quarter of 2019.
- Third quarter 2020 adjusted net income (a non-GAAP financial measure) was $11.6 million, or adjusted net income of $0.10 per diluted common share, a sequential increase from an adjusted net loss of $3.1 million in the second quarter of 2020, and a year-over-year decrease from adjusted net income of $37.9 million in the third quarter of 2019. The sequential increase in adjusted net income was primarily attributable to significantly better third quarter 2020 realized oil and natural gas prices of $38.67 per barrel and $2.27 per thousand cubic feet, respectively, that were 61% and 52% above second quarter 2020 realized oil and natural gas prices of $24.03 per barrel and $1.49 per thousand cubic feet, respectively. The year-over-year decrease in adjusted net income was primarily attributable to the 29% decline in realized oil prices from $54.19 per barrel in the third quarter of 2019 to $38.67 per barrel in the third quarter of 2020, which was mitigated by increased production and decreased per-unit operating costs between the periods.
- Third quarter 2020 adjusted earnings before interest expense, income taxes, depletion, depreciation and amortization and certain other items ("Adjusted EBITDA," a non-GAAP financial measure) were $121.0 million, a sequential increase from $107.6 million in the second quarter of 2020, and a year-over-year decrease from $160.8 million in the third quarter of 2019. The changes in sequential and year-over-year Adjusted EBITDA were primarily attributable to the changes in oil and natural gas prices realized between the comparable periods, which were mitigated by increased production and decreased per-unit operating costs, particularly on a year-over-year basis. Matador expects Adjusted EBITDA in the fourth quarter of 2020 to be between $128 and $134 million, based upon its estimates for production growth in the fourth quarter and assuming strip prices for oil and natural gas as of late October 2020.
Record-Low Lease Operating and Near Record-Low General and Administrative Unit Costs
- Lease operating expenses ("LOE") in the third quarter of 2020 were a Matador-record low of $3.48 per BOE, an 11% sequential decrease from $3.92 per BOE in the second quarter of 2020, and a 25% year-over-year decrease from $4.64 per BOE in the third quarter of 2019. This record low LOE per BOE in the third quarter resulted primarily from (1) the Company's ongoing efforts to reduce costs and improve the efficiency of its operations, (2) additional produced water being transported to disposal facilities by pipeline, including via San Mateo's gathering systems, thereby reducing trucking costs and (3) lower service costs.
- General and administrative expenses ("G&A") in the third quarter of 2020 were $2.25 per BOE, a 2% sequential increase from $2.21 per BOE in the second quarter of 2020, and a 29% year-over-year decrease from $3.18 per BOE in the third quarter of 2019. Matador's G&A expenses continue to be positively impacted primarily from the G&A cost reductions initially implemented in the first quarter of 2020.
Record-Low Drilling and Completion Costs Below $800 Per Completed Lateral Foot
- Drilling and completion costs for all operated horizontal wells completed and turned to sales in the third quarter of 2020 averaged $790 per completed lateral foot, a sequential decrease of 10% from average drilling and completion costs of $881 per completed lateral foot in the second quarter of 2020, and a decrease of 32% from average drilling and completion costs of $1,165 per completed lateral foot achieved in full year 2019. Drilling and completion costs of $790 per completed lateral foot were the lowest quarterly drilling and completion costs per completed lateral foot in Matador's history.
- Matador incurred capital expenditures for drilling, completing and equipping wells ("D/C/E capital expenditures") of approximately $95 million in the third quarter of 2020, or 19% below the Company's estimate of $117 million for D/C/E capital expenditures during the quarter. Matador estimates that approximately $10 million of these savings were directly attributable to improved operational efficiencies and lower-than-expected drilling and completion costs in the Delaware Basin. The remainder of these cost savings primarily resulted from the timing of both operated and non-operated drilling and completion activities, and most of these costs are currently expected to be incurred in the fourth quarter of 2020.
Borrowing Base Reaffirmed and Total Borrowings Below Expectations
- In October 2020, as part of the fall 2020 redetermination process, Matador's lenders reaffirmed the Company's borrowing base under its reserves-based credit facility at $900 million. Matador's elected commitment also remained constant at $700 million, and no changes were made to the terms of the Company's reserves-based credit facility. The $900 million borrowing base and the $700 million elected commitment should provide Matador with more-than-sufficient liquidity for conducting its current and future operations for the remainder of 2020 and going forward in 2021.
- At September 30, 2020, total borrowings outstanding under Matador's reserves-based credit facility were $475 million, $25 million less than the Company's expectations for the end of the third quarter. These lower-than-anticipated borrowings were primarily attributable to Matador's continued capital and operating cost efficiencies during the third quarter. Matador currently expects to generate positive free cash flow in the fourth quarter of 2020 and plans to use this free cash flow to reduce borrowings under its reserves-based credit facility.
Note: All references to Matador's net income (loss), adjusted net income (loss) and Adjusted EBITDA reported throughout this earnings release are those values attributable to Matador Resources Company shareholders after giving effect to any net income, net loss or Adjusted EBITDA, respectively, attributable to third-party non-controlling interests, including in San Mateo Midstream, LLC ("San Mateo I") and San Mateo Midstream II, LLC ("San Mateo II," and, together with San Mateo I, "San Mateo"). Matador owns 51% of San Mateo. For a definition of adjusted net income (loss), adjusted earnings (loss) per diluted common share and Adjusted EBITDA and reconciliations of such non-GAAP financial metrics to their comparable GAAP metrics, please see "Supplemental Non-GAAP Financial Measures" below.
Sequential and year-over-year quarterly comparisons of selected financial and operating items are shown in the following table:
|
Three Months Ended |
||||||||||||||
|
September 30, 2020 |
June 30, 2020 |
September 30, 2019 |
||||||||||||
|
Net Production Volumes:(1) |
||||||||||||||
|
Oil (MBbl)(2) |
3,895 |
3,920 |
3,659 |
|||||||||||
|
Natural gas (Bcf)(3) |
16.9 |
16.5 |
16.5 |
|||||||||||
|
Total oil equivalent (MBOE)(4) |
6,715 |
6,670 |
6,407 |
|||||||||||
|
Average Daily Production Volumes:(1) |
||||||||||||||
|
Oil (Bbl/d)(5) |
42,340 |
43,074 |
39,776 |
|||||||||||
|
Natural gas (MMcf/d)(6) |
183.9 |
181.4 |
179.2 |
|||||||||||
|
Total oil equivalent (BOE/d)(7) |
72,989 |
73,302 |
69,645 |
|||||||||||
|
Average Sales Prices: |
||||||||||||||
|
Oil, without realized derivatives (per Bbl) |
$ |
38.67 |
$ |
24.03 |
$ |
54.19 |
||||||||
|
Oil, with realized derivatives (per Bbl) |
$ |
37.28 |
$ |
35.28 |
$ |
54.97 |
||||||||
|
Natural gas, without realized derivatives (per Mcf)(8) |
$ |
2.27 |
$ |
1.49 |
$ |
1.88 |
||||||||
|
Natural gas, with realized derivatives (per Mcf) |
$ |
2.27 |
$ |
1.49 |
$ |
1.91 |
||||||||
|
Revenues (millions): |
||||||||||||||
|
Oil and natural gas revenues |
$ |
189.1 |
$ |
118.8 |
$ |
229.4 |
||||||||
|
Third-party midstream services revenues |
$ |
19.4 |
$ |
14.7 |
$ |
15.3 |
||||||||
|
Lease bonus - mineral acreage |
$ |
- |
$ |
4.1 |
$ |
1.7 |
||||||||
|
Realized (loss) gain on derivatives |
$ |
(5.4 |
) |
$ |
44.1 |
$ |
3.3 |
|||||||
|
Operating Expenses (per BOE): |
||||||||||||||
|
Production taxes, transportation and processing |
$ |
3.85 |
$ |
2.82 |
$ |
3.86 |
||||||||
|
Lease operating |
$ |
3.48 |
$ |
3.92 |
$ |
4.64 |
||||||||
|
Plant and other midstream services operating |
$ |
1.40 |
$ |
1.47 |
$ |
1.38 |
||||||||
|
Depletion, depreciation and amortization |
$ |
13.11 |
$ |
14.00 |
$ |
14.44 |
||||||||
|
General and administrative(9) |
$ |
2.25 |
$ |
2.21 |
$ |
3.18 |
||||||||
|
Total(10) |
$ |
24.09 |
$ |
24.42 |
$ |
27.50 |
||||||||
|
Other (millions): |
||||||||||||||
|
Net sales of purchased natural gas(11) |
$ |
2.2 |
$ |
3.1 |
$ |
3.3 |
||||||||
|
Net (loss) income (millions)(12) |
$ |
(276.1 |
) |
$ |
(353.4 |
) |
$ |
44.0 |
||||||
|
(Loss) earnings per common share (diluted)(12) |
$ |
(2.38 |
) |
$ |
(3.04 |
) |
$ |
0.38 |
||||||
|
Adjusted net income (loss) (millions)(12)(13) |
$ |
11.6 |
$ |
(3.1 |
) |
$ |
37.9 |
|||||||
|
Adjusted earnings (loss) per common share (diluted)(12)(14) |
$ |
0.10 |
$ |
(0.03 |
) |
$ |
0.32 |
|||||||
|
Adjusted EBITDA (millions)(12)(15) |
$ |
121.0 |
$ |
107.6 |
$ |
160.8 |
||||||||
|
San Mateo net income (millions) |
$ |
20.3 |
$ |
15.3 |
$ |
20.0 |
||||||||
|
San Mateo Adjusted EBITDA (millions)(15) |
$ |
28.0 |
$ |
23.2 |
$ |
26.3 |
||||||||
|
(1) |
Production volumes reported in two streams: oil and natural gas, including both dry and liquids rich natural gas. |
|
|
(2) |
One thousand barrels of oil. |
|
|
(3) |
One billion cubic feet of natural gas. |
|
|
(4) |
One thousand barrels of oil equivalent, estimated using a conversion ratio of one barrel of oil per six thousand cubic feet of natural gas. |
|
|
(5) |
Barrels of oil per day. |
|
|
(6) |
Millions of cubic feet of natural gas per day. |
|
|
(7) |
Barrels of oil equivalent per day, estimated using a conversion ratio of one barrel of oil per six thousand cubic feet of natural gas. |
|
|
(8) |
Per thousand cubic feet of natural gas. |
|
|
(9) |
Includes approximately $0.50, $0.49 and $0.73 per BOE of non-cash, stock-based compensation expense in the third quarter of 2020, the second quarter of 2020 and the third quarter of 2019, respectively. |
|
|
(10) |
Total does not include the impact of full-cost ceiling impairment charges, purchased natural gas or immaterial accretion expenses. |
|
|
(11) |
Net sales of purchased natural gas refers to residue natural gas and natural gas liquids ("NGL") that are purchased from customers and subsequently resold. Such amounts reflect revenues from sales of purchased natural gas of $13.4 million, $14.0 million and $19.9 million less expenses of $11.1 million, $10.9 million and $16.6 million in the third quarter of 2020, the second quarter of 2020 and the third quarter of 2019, respectively. |
|
|
(12) |
Attributable to Matador Resources Company shareholders. |
|
|
(13) |
Adjusted net income (loss) is a non-GAAP financial measure. For a definition of adjusted net income (loss) and a reconciliation of adjusted net income (loss) (non-GAAP) to net income (loss) (GAAP), please see "Supplemental Non-GAAP Financial Measures." |
|
|
(14) |
Adjusted earnings (loss) per diluted common share is a non-GAAP financial measure. For a definition of adjusted earnings (loss) per diluted common share and a reconciliation of adjusted earnings (loss) per diluted common share (non-GAAP) to earnings (loss) per diluted common share (GAAP), please see "Supplemental Non-GAAP Financial Measures." |
|
|
(15) |
Adjusted EBITDA is a non-GAAP financial measure. For a definition of Adjusted EBITDA and a reconciliation of Adjusted EBITDA (non-GAAP) to net income (loss) (GAAP) and net cash provided by operating activities (GAAP), please see "Supplemental Non-GAAP Financial Measures." |
|
Full Year 2020 Production Guidance Updated
As shown in the table below, at October 27, 2020, Matador further updated its full year 2020 production guidance as previously updated on July 28, 2020. The Company also updated its full year 2020 guidance for capital expenditures to drill, complete and equip wells and for Matador's portion of San Mateo's capital expenditures.
|
2020 Guidance Estimates |
|||||
|
Guidance Metric |
Actual 2019 Results |
July 28, 2020(1) |
% YoY Change(2) |
October 27, 2020(3) |
% YoY Change(4) |
|
Total Oil Production, million Bbl |
14.0 |
15.35 to 15.65 |
+11% |
15.7 to 15.8 |
+13% |
|
Total Natural Gas Production, Bcf |
61.1 |
65.5 to 68.5 |
+10% |
68.0 to 69.0 |
+12% |
|
Total Oil Equivalent Production, million BOE |
24.2 |
26.3 to 27.1 |
+10% |
27.0 to 27.3 |
+12% |
|
D/C/E CapEx(5), million $ |
$671 |
$440 to $500 |
-30% |
$455 to $475 |
-31% |
|
San Mateo Midstream CapEx(6), million $ |
$77 |
$85 to $105 |
+23% |
$90 to $100 |
+23% |
|
(1) |
As of and as provided on July 28, 2020. |
|
|
(2) |
Represents percentage change from 2019 actual results to the midpoint of previous 2020 guidance, as provided on July 28, 2020. |
|
|
(3) |
As of and as updated on October 27, 2020. |
|
|
(4) |
Represents percentage change from 2019 actual results to the midpoint of updated 2020 guidance, as provided on October 27, 2020. |
|
|
(5) |
Capital expenditures associated with drilling, completing and equipping wells. |
|
|
(6) |
Primarily reflects Matador's share of 2020 estimated capital expenditures for San Mateo and accounts for remaining portions of the $50 million capital carry an affiliate of Five Point Energy LLC ("Five Point") provided as part of the San Mateo II expansion in Eddy County, New Mexico. |
|
Fourth Quarter 2020 Updated Completions and Production Cadence
Fourth Quarter 2020 Drilling and Completion Activity
Matador expects to operate three drilling rigs in the Delaware Basin during the fourth quarter of 2020, with two of these rigs operating in the Stateline asset area. The third rig is currently drilling four additional wells on the Rodney Robinson tract in the western portion of Matador's Antelope Ridge asset area, which the Company does not expect to turn to sales until late in the first quarter of 2021. In addition, Matador expects to complete and turn to sales five gross (2.7 net) operated wells in the fourth quarter of 2020, all of which will be two-mile laterals in the Rustler Breaks asset area.
Matador expects to incur an additional $10 million in D/C/E capital expenditures above its previous estimates in the fourth quarter of 2020, resulting from its participation in a number of non-operated wells in the Delaware Basin that were previously anticipated to be drilled and/or completed in early 2021. Further, Matador expects to incur another $5 to $7 million of incremental D/C/E capital expenditures in the fourth quarter previously attributed to anticipated 2021 operations, resulting from accelerated operations on the Voni wells in the Stateline asset area. As a result of the cost savings and improved capital efficiencies achieved in Matador's operated drilling program in recent quarters, however, Matador anticipates it should be able to accommodate these incremental capital expenditures while still lowering its estimates for total 2020 D/C/E capital expenditures by about $5 million at the midpoint of its updated guidance range.
Fourth Quarter 2020 Oil, Natural Gas and Oil Equivalent Production
At October 27, 2020, Matador expects its fourth quarter 2020 average daily oil equivalent production, oil production and natural gas production to increase 8 to 10% sequentially.
Significant Well Results
The following table highlights the 24-hour initial potential ("IP") test results from the 13 Boros wells in the Stateline asset area in southeastern Eddy County, New Mexico, all of which are two-mile laterals. All 13 wells were completed and turned to sales at varying times during September 2020. Matador acquired the 2,800 gross and net acres comprising its Stateline asset area as part of the September 2018 Bureau of Land Management lease sale, and the 13 Boros wells were all drilled and completed on the eastern portion of this leasehold. The 24-hour IP test results from the first four Boros wells completed and turned to sales were previously reported in a separate press release on September 22, 2020, but all 13 wells are summarized below for completeness.
|
Completion |
24-hr IP |
BOE/d / |
Oil |
||||||||
|
Asset Area/Well Name |
Interval |
(BOE/d) |
1,000 ft.(1) |
(%) |
Comments |
||||||
|
Stateline, Eddy County, NM |
|||||||||||
|
Boros #104H |
Avalon |
2,423 |
241 |
65% |
Tested 1,573 Bbl of oil per day and 5.1 MMcf of natural gas per day. |
||||||
|
Boros #123H |
Second Bone Spring |
3,160 |
310 |
68% |
Tested 2,150 Bbl of oil per day and 6.1 MMcf of natural gas per day. |
||||||
|
Boros #124H |
Second Bone Spring |
3,329 |
331 |
71% |
Tested 2,368 Bbl of oil per day and 5.8 MMcf of natural gas per day. |
||||||
|
Boros #201H |
Wolfcamp A-XY |
3,147 |
323 |
60% |
Tested 1,874 Bbl of oil per day and 7.6 MMcf of natural gas per day. |
||||||
|
Boros #202H |
Wolfcamp A-XY |
3,128 |
318 |
62% |
Tested 1,953 Bbl of oil per day and 7.0 MMcf of natural gas per day. |
||||||
|
Boros #203H |
Wolfcamp A-XY |
3,668 |
375 |
59% |
Tested 2,146 Bbl of oil per day and 9.1 MMcf of natural gas per day. |
||||||
|
Boros #204H |
Wolfcamp A-XY |
3,227 |
330 |
58% |
Tested 1,878 Bbl of oil per day and 8.1 MMcf of natural gas per day. |
||||||
|
Boros #215H |
Wolfcamp A-Lower |
4,600 |
461 |
60% |
Tested 2,750 Bbl of oil per day and 11.1 MMcf of natural gas per day. |
||||||
|
Boros #216H |
Wolfcamp A-Lower |
3,569 |
357 |
59% |
Tested 2,113 Bbl of oil per day and 8.7 MMcf of natural gas per day. |
||||||
|
Boros #217H |
Wolfcamp A-Lower |
3,806 |
384 |
54% |
Tested 2,060 Bbl of oil per day and 10.5 MMcf of natural gas per day. |
||||||
|
Boros #218H |
Wolfcamp A-Lower |
4,496 |
462 |
55% |
Tested 2,473 Bbl of oil per day and 12.1 MMcf of natural gas per day. |
||||||
|
Boros #223H |
Wolfcamp B-Lower |
3,257 |
326 |
19% |
Tested 618 Bbl of oil per day and 15.8 MMcf of natural gas per day. |
||||||
|
Boros #224H |
Wolfcamp B-Upper |
3,415 |
342 |
37% |
Tested 1,249 Bbl of oil per day and 13.0 MMcf of natural gas per day. |
||||||
|
TOTAL/AVERAGE |
45,225 |
350 |
56% |
Tested 25,205 Bbl of oil per day and 120.0 MMcf of natural gas per day. |
|||||||
|
(1) 24-hour IP per 1,000 feet of completed lateral length. |
|||||||||||
Matador is extremely pleased with the various 24-hour IP test results from six different intervals in the Boros wells. The IP test results from the Boros #123H and #124H wells are the top two IP test results that Matador has reported to date for wells completed and turned to sales in the Second Bone Spring formation throughout the Delaware Basin. Similarly, the IP test results from the Boros #215H, #216H and #217H wells are three of the top four IP test results that Matador has achieved to date for wells completed and turned to sales in the Wolfcamp A-Lower formation. In addition, most of these 24-hour IP test results were recorded at very high flowing casing pressures of between 3,000 and 4,200 pounds per square inch ("psi") in the Wolfcamp A-XY, Wolfcamp A-Lower and Wolfcamp B formations, further indicating the strong productivity of these wells. All 13 Boros wells highlighted in this release are currently producing at restricted flow rates (well below the test rates noted in the table above) through Matador's newly constructed production facilities in the Stateline asset area. All oil, natural gas and water from these wells has been gathered via San Mateo's infrastructure since the wells were initially turned to sales.
As previously reported, drilling and completion costs for all 13 Boros wells in the Stateline asset area averaged just under $800 per completed lateral foot. The drilling and completion costs for the three shallowest wells, one Avalon and two Second Bone Spring completions, averaged approximately $725 per completed lateral foot. These costs are among the lowest drilling and completion costs per lateral foot that Matador has achieved to date in the Delaware Basin.
Operations Update
Drilling and Completion Activity
Matador operated three drilling rigs in the Delaware Basin during the third quarter of 2020 and continues to do so today. Matador expects to operate these three drilling rigs in the Delaware Basin throughout the remainder of 2020 and into 2021. Two of these rigs are expected to operate in the Stateline asset area and one rig is expected to operate primarily in the Rodney Robinson leasehold in the western portion of the Antelope Ridge asset area during the fourth quarter of 2020.
Wells Completed and Turned to Sales
During the third quarter of 2020, Matador completed and turned to sales a total of 27 gross (19.3 net) wells in its various operating areas. This total was comprised of 20 gross (19.1 net) operated wells and seven gross (0.2 net) non-operated wells. Of the 20 operated wells, 100% had completed lateral lengths greater than one mile and 90% were two-mile laterals.
|
Operated |
Non-Operated |
Total |
Gross Operated and Non-Operated |
|||||||
|
Asset/Operating Area |
Gross |
Net |
Gross |
Net |
Gross |
Net |
Well Completion Intervals |
|||
|
Antelope Ridge |
- |
- |
7 |
0.2 |
7 |
0.2 |
4-3BS, 3-WC A |
|||
|
Arrowhead |
5 |
4.3 |
- |
- |
5 |
4.3 |
2-WC A, 2-3BS, 1-WC B |
|||
|
Ranger |
- |
- |
- |
- |
- |
- |
No wells turned to sales in Q3 2020 |
|||
|
Rustler Breaks |
- |
- |
- |
- |
- |
- |
No wells turned to sales in Q3 2020 |
|||
|
Stateline |
13 |
13.0 |
- |
- |
13 |
13.0 |
8-WC A, 2-WC B, 2-2BS, 1-AV |
|||
|
Twin Lakes |
- |
- |
- |
- |
- |
- |
No wells turned to sales in Q3 2020 |
|||
|
Wolf/Jackson Trust |
2 |
1.8 |
- |
- |
2 |
1.8 |
2-WC A |
|||
|
Delaware Basin |
20 |
19.1 |
7 |
0.2 |
27 |
19.3 |
||||
|
South Texas |
- |
- |
- |
- |
- |
- |
No wells turned to sales in Q3 2020 |
|||
|
Haynesville Shale |
- |
- |
- |
- |
- |
- |
No wells turned to sales in Q3 2020 |
|||
|
Total |
20 |
19.1 |
7 |
0.2 |
27 |
19.3 |
||||
Note: WC = Wolfcamp; BS = Bone Spring; AV = Avalon. For example, 4-3BS indicates four Third Bone Spring completions and 8-WC A indicates eight Wolfcamp A completions.
Realized Commodity Prices
Oil Prices
Matador's weighted average realized oil price, excluding derivatives, increased 61% sequentially from $24.03 per barrel in the second quarter of 2020 to $38.67 per barrel in the third quarter of 2020. Matador's weighted average oil price differential relative to the West Texas Intermediate ("WTI") benchmark price improved from ($3.97) per barrel in the second quarter of 2020 to ($2.25) per barrel in the third quarter of 2020, inclusive of the monthly roll and transportation costs.
For the fourth quarter of 2020, Matador's weighted average oil price differential relative to the WTI benchmark price is anticipated to be in the range of ($2.00) to ($3.00), inclusive of the monthly roll and transportation costs.
Matador's realized loss on derivatives of approximately $5.4 million in the third quarter of 2020 was primarily attributable to certain losses associated with its oil swaps with a strike price of $35.00 per barrel. The Company put these oil swaps in place when restructuring its oil hedges early in the second quarter of 2020 to protect the balance sheet and ensure it would remain in compliance with its reserves-based loan leverage covenant in 2020. Overall, this restructuring of the Company's oil hedges has proven effective, and Matador realized a net gain on derivatives of $49.6 million for the nine months ended September 30, 2020. Please see the accompanying slide presentation for a more complete summary of Matador's current hedging positions.
Natural Gas Prices
Matador's weighted average realized natural gas price, excluding derivatives, increased 52% sequentially from $1.49 per thousand cubic feet in the second quarter of 2020 to $2.27 per thousand cubic feet in the third quarter of 2020. Matador realized a weighted average natural gas price differential of +$0.15 per thousand cubic feet above the average NYMEX Henry Hub natural gas price in the third quarter, as compared to a differential of ($0.26) per thousand cubic feet below the average NYMEX Henry Hub natural gas price in the second quarter of 2020. Matador is a two-stream reporter, and the revenues associated with its NGL production are included in the weighted average realized natural gas price.
For the fourth quarter of 2020, Matador's weighted average natural gas price differential relative to the Henry Hub benchmark price is anticipated to be in the range of ($0.20) to +$0.20.
Matador realized no gains or losses on any of its natural gas hedges in place during the third quarter of 2020.
San Mateo Highlights and Update
Black River Processing Plant Expansion and Large-Diameter Gathering Lines Completed and Placed in Service
During the third quarter of 2020, Matador's midstream affiliate, San Mateo, completed the construction and successful start-up of the expansion of its cryogenic natural gas processing plant in Eddy County, New Mexico (the "Black River Processing Plant"). The expansion of the Black River Processing Plant added an incremental designed inlet capacity of 200 million cubic feet of natural gas per day to the previously designed inlet capacity of 260 million cubic feet per day for a total designed inlet capacity of 460 million cubic feet per day. The plant expansion project was completed on time and on budget. The expanded Black River Processing Plant supports Matador's exploration and development activities in the Delaware Basin and is currently gathering and processing natural gas from Matador's Stateline asset area and from the Greater Stebbins Area. The Black River Processing Plant also processes natural gas from Matador's Rustler Breaks asset area and provides natural gas processing services for other San Mateo customers in the area.
In September 2020, San Mateo also completed and placed in service approximately 43 miles of large diameter natural gas gathering pipelines between the Black River Processing Plant and the Company's Stateline asset area (24 miles) and the Greater Stebbins Area (19 miles). In addition, San Mateo completed and placed in service approximately 19 miles of various diameter crude oil pipelines from certain points of origin in the Greater Stebbins Area to the existing San Mateo interconnect with a subsidiary of Plains All American Pipeline, L.P. in Eddy County, New Mexico. San Mateo is currently gathering or transporting Matador's oil and natural gas production via pipeline in both the Stateline asset area and the Greater Stebbins Area, as well as in the Wolf and Rustler Breaks asset areas. San Mateo is handling Matador's produced water in each of these areas as well.
Following the completion of the significant expansion projects noted above, San Mateo's three-pipe midstream system now includes:
- Natural Gas Assets: 460 million cubic feet per day of designed natural gas cryogenic processing capacity and approximately 140 miles of natural gas gathering pipelines in Eddy County, New Mexico and Loving County, Texas, including 43 miles of large-diameter natural gas gathering lines spanning from Matador's Stateline asset area to the Greater Stebbins Area in Eddy County, New Mexico;
- Oil Assets: Three oil central delivery points (CDPs) with over 100,000 barrels of designed oil throughput capacity and approximately 90 miles of oil gathering and transportation pipelines in Eddy County, New Mexico and Loving County, Texas, as well as a 400,000-acre joint development area with a subsidiary of Plains All American Pipeline, L.P. to gather Matador's and other producers' oil production in Eddy County, New Mexico; and
- Produced Water Assets: 13 commercial salt water disposal wells and associated facilities with designed produced water disposal capacity of 335,000 barrels per day and approximately 105 miles of produced water gathering pipelines in Eddy County, New Mexico and Loving County, Texas.
Operating Highlights and Financial Results
San Mateo's operations in the third quarter of 2020 were highlighted by sequential increases in water handling and oil gathering volumes. As expected, sequential natural gas gathering and processing volumes declined slightly in the third quarter of 2020. San Mateo anticipates that natural gas gathering and processing volumes, water handling volumes and oil gathering volumes should all increase significantly in the fourth quarter of 2020 as Matador realizes the first full quarter of production from the Boros wells in the Stateline asset area and the Leatherneck wells in the Greater Stebbins Area.
Operating Highlights
During the third quarter of 2020, San Mateo:
- Handled an average of 233,400 barrels of produced water per day, an 8% sequential increase, as compared to 216,800 barrels per day in the second quarter of 2020, and a 13% year-over-year increase, as compared to 206,300 barrels per day in the third quarter of 2019.
- Gathered an average of 30,600 barrels of oil per day, a 12% sequential increase, as compared to 27,300 barrels of oil per day in the second quarter of 2020, and a 31% year-over-year increase, as compared to 23,300 barrels per day in the third quarter of 2019.
- Gathered an average of 192.9 million cubic feet of natural gas per day, a 1% sequential decrease, as compared to 195.3 million cubic feet per day in the second quarter of 2020, and an 11% year-over-year decrease, as compared to 216.2 million cubic feet per day in the third quarter of 2019.
- Processed an average of 150.4 million cubic feet of natural gas per day at the Black River Processing Plant, a 7% sequential decrease, as compared to 161.7 million cubic feet per day in the second quarter of 2020, and a 20% year-over-year decrease, as compared to 188.0 million cubic feet per day in the third quarter of 2019.
Financial Results
During the third quarter of 2020, San Mateo achieved better-than-anticipated financial results, including:
- Net income (GAAP basis) of $20.3 million, a 33% sequential increase from $15.3 million in the second quarter of 2020, and a 2% year-over-year increase from $20.0 million in the third quarter of 2019. This quarterly result was above the Company's expectations for the third quarter, primarily resulting from the stronger-than-expected initial volumes from Matador's Boros and Leatherneck wells and lower-than-projected operating costs. San Mateo's net income is also expected to increase sequentially in the fourth quarter of 2020.
- Adjusted EBITDA (a non-GAAP financial measure) of $28.0 million, a 21% sequential increase from $23.2 million in the second quarter of 2020, and a 6% year-over-year increase from $26.3 million in the third quarter of 2019. This quarterly result was above the Company's expectations for the third quarter for the reasons noted above. San Mateo's Adjusted EBITDA is also expected to increase sequentially in the fourth quarter of 2020 to between $31 and $34 million, based upon estimates for increased throughput and processing services in the fourth quarter.
Capital Expenditures
Matador's portion of San Mateo's capital expenditures was approximately $28 million in the third quarter of 2020, about $10 million less than the Company's estimate of $38 million for the quarter, primarily attributable to both cost savings on completed projects and the timing of construction operations. Matador now expects to incur the remaining $14 million of its portion of San Mateo's projected 2020 capital expenditures of approximately $95 million in the fourth quarter of 2020.
Related Categories :
Third Quarter (3Q) Update
More Third Quarter (3Q) Update News
-
Evolution Petroleum Corporation Fiscal Third Quarter 2023 Results
-
Civitas Resources Third Quarter 2022 Results
-
Murphy Oil Third Quarter 2022 Results
-
ConocoPhillips Third Quarter 2022 Results
-
California Resources Third Quarter 2022 Results
Gulf Coast News >>>
-
Seventeen (17) E&Ps; To Use 47 Frac Crews To Complete 2,800 Wells In 2024

-
These Permian Operators Plan to Complete/Frac 2,100 Wells IN 2024

-
Large E&P Chops Permian/Anadarko Basin Frac Activity by 30% In 2024

-
Permian E&P Ups 2024 Well Completed by +27% vs. 2023

-
Contrary to The Noise, U.S. Oil Production will Likely Growth 4-5% In 2024; A look Inside -


