
Quarterly / Earnings Reports | Second Quarter (2Q) Update | Financial Results | Hedging | Capital Markets | Capital Expenditure | Drilling Activity | 2020 Guidance
Oasis Petroleum Second Quarter 2020 Results

Oasis Petroleum Inc. reported its Q2 2020 results and updated its 2020 outlook.
2Q20 Highlights:
- Delivered net cash used in operating activities of $47.9 million and Adjusted EBITDA of $174.2 million in 2Q20.
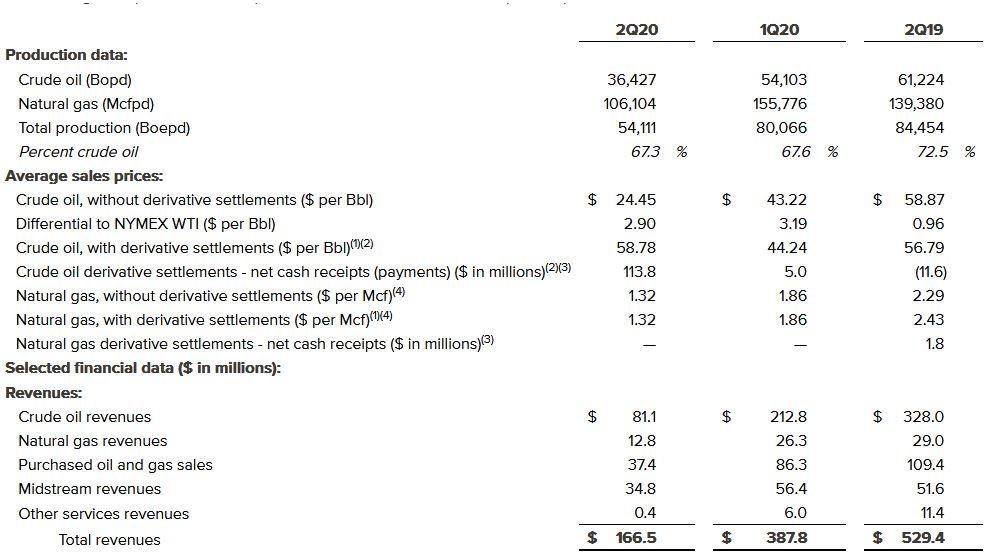
- Produced 54.1 MBoepd in 2Q20 with oil volumes at 36.4 MBopd
- E&P CapEx was $36.9 million for 2Q20
- LOE per Boe decreased 12% to $6.01 per Boe in 2Q20 as compared to $6.83 per Boe in 1Q20
- Crude oil differentials were solid over 2Q20, averaging $2.90 off of NYMEX WTI
- E&P pre-tax loss was $116.4 million and E&P Free Cash Flow was $92.7 million in 2Q20
- Midstream pre-tax income including non-controlling interests was $25.3 million and Midstream Adjusted EBITDA(1) was $44.2 million in 2Q20. Oasis Midstream Partners LP declared a distribution of $0.54 per unit, unchanged from 1Q20
- Continued to achieve industry-leading gas capture of approximately 96% across the entire Williston position and approximately 93% in the Delaware position
Updated 2020 Outlook
- Expecting 2H20 E&P CapEx of $60 million to $75 million. Full year 2020 E&P CapEx of $248 million to $263 million is 54-58% below original February 2020 guidance and towards the low-end of the CapEx range provided in May 2020.
- Volumes have steadily increased from trough levels observed in May 2020. 3Q20 and 4Q20 oil volumes are expected to approximate 40-42 MBopd, approximately 13% above 2Q20 levels based on current market conditions.
- Expecting to generate free cash flow at strip NYMEX WTI prices based on the Company's revised 2020 plan.
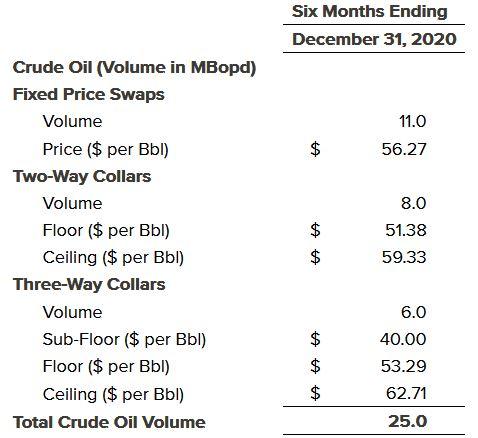
- 2H20 hedged volumes of 25 MBopd drive mark-to-market value of $85 million as of June 30, 2020.
- Midstream CapEx is expected to range between $5 million to $10 million in 2H20. Full year 2020 midstream CapEx of $36 million to $40 million is more than 60% below original February 2020 guidance. Approximately 25% of 2020 midstream CapEx is attributed to Oasis. See the Oasis Midstream Partners LP ("OMP") press release issued on August 5, 2020 for more details.
Chairman and Chief Executive Officer, Thomas B. Nusz, commented, "Oasis executed well through an exceptionally tumultuous period. The Oasis team responded swiftly and effectively, powering down activity in an orderly manner, significantly lowering operating cost structure and capital while maintaining the integrity of our infrastructure to enhance flexibility for the future. The team was successful in keeping per unit lease operating expense low despite significant shut-ins reflecting meticulous cost management, including a carefully planned curtailment process, pricing concessions, labor optimization, and deferring workovers. Strip pricing has improved materially, but Oasis will maintain a prudent approach to future activity. Capital efficiency improvements and a significantly lower cost structure will improve economics for future development. Additionally, cash generation and free cash flow benefit from a robust hedge position and our midstream ownership which continues to support industry leading gas capture. As always, we remain focused on the health and safety of our employees, contractors, and communities."
Select Financial Metrics
The following table presents select financial data for the period presented:
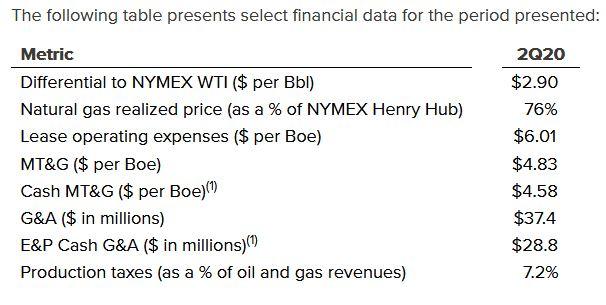
G&A totaled $37.4 million in 2Q20, $30.9 million in 2Q19 and $31.2 million in 1Q20. Amortization of equity-based compensation, which is included in G&A, was $4.9 million, or $0.99 per barrel of oil equivalent ("Boe"), in 2Q20 as compared to $8.9 million, or $1.16 per Boe, in 2Q19 and $6.8 million, or $0.93 per Boe, in 1Q20. G&A for the Company's E&P segment, excluding G&A expenses attributable to other services, totaled $33.5 million in 2Q20, $25.8 million in 2Q19 and $23.3 million in 1Q20. E&P Cash G&A (non-GAAP) expenses, excluding G&A expenses attributable to other services, non-cash equity-based compensation expenses and other non-cash charges, were $5.84 per Boe in 2Q20, $2.24 per Boe in 2Q19 and $2.29 per Boe for 1Q20. For a definition of E&P Cash G&A expenses and a reconciliation of G&A expenses to E&P Cash G&A, see "Non-GAAP Financial Measures" below.
Impairment expense was $2.3 million in 2Q20 as compared to $4.8 billion in 1Q20. In 2Q20, the Company recorded impairment charges of $1.0 million on its equipment and materials inventory, $0.8 million on its unproved oil and gas properties and $0.6 million on its prepaid midstream equipment. In 1Q20, the Company recorded impairment charges of $4.4 billion on its proved oil and gas properties in the Williston Basin and the Delaware Basin, $291.3 million on its unproved oil and gas properties, $108.3 million on its midstream assets and $15.8 million on its well services assets.
Interest expense was $44.4 million in 2Q20 as compared to $43.2 million in 2Q19 and $95.8 million in 1Q20. Capitalized interest totaled $1.8 million in 2Q20, $3.6 million in 2Q19 and $2.3 million in 1Q20. Cash Interest (non-GAAP) totaled $39.0 million in 2Q20, $42.0 million in 2Q19 and $93.5 million in 1Q20. For a definition of Cash Interest and a reconciliation of interest expense to Cash Interest, see "Non-GAAP Financial Measures" below.
In 2Q20, the Company recorded an income tax benefit of $2.6 million, resulting in a 2.7% effective tax rate as a percentage of its pre-tax loss for the quarter. In 1Q20, the Company recorded an income tax benefit of $254.7 million, resulting in a 5.6% effective tax rate as a percentage of its pre-tax loss for the quarter.
In 2Q20, the Company reported a net loss of $92.9 million, or $0.29 per diluted share, as compared to net income of $42.8 million, or $0.14 per diluted share, in 2Q19. Excluding certain non-cash items and their tax effect, Adjusted Net Income Attributable to Oasis (non-GAAP) was $73.5 million, or $0.23 per diluted share, in 2Q20, as compared to Adjusted Net Income Attributable to Oasis of $11.0 million, or $0.03 per diluted share, in 2Q19. Adjusted EBITDA (non-GAAP) in 2Q20 was $174.2 million, which included $25.3 million for derivatives monetized in 2Q20, as compared to Adjusted EBITDA of $249.6 million in 2Q19. For definitions of Adjusted Net Income (Loss) Attributable to Oasis and Adjusted EBITDA and reconciliations to the most directly comparable financial measures under GAAP, see "Non-GAAP Financial Measures" below.
Capital Expenditures and Completions
The following table presents the Company's total capital expenditures ("CapEx") by category for the periods presented:
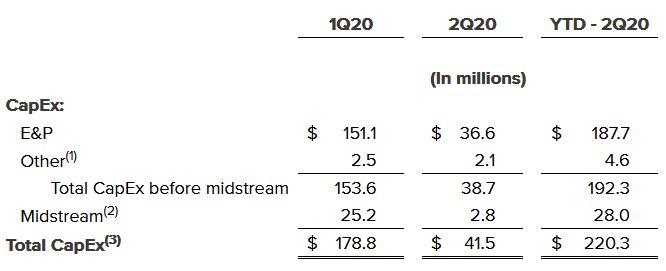
Oasis completed 3 gross (1.9 net) operated wells in the Williston Basin and 6 gross (5.0 net) operated wells in the Delaware Basin.
Liquidity and Balance Sheet
As of June 30, 2020, Oasis had cash and cash equivalents of $77.4 million, total elected commitments under its revolving credit facility (the "Oasis Credit Facility") of $612.5 million and total elected commitments under the revolving credit facility among OMP, as parent, OMP Operating LLC, a subsidiary of OMP, as borrower, Wells Fargo Bank, N.A., as administrative agent and the lenders party thereto (the "OMP Credit Facility") of $575.0 million. In addition, Oasis had $502.0 million of borrowings and $71.6 million of outstanding letters of credit issued under the Oasis Credit Facility and $487.5 million of borrowings and a de minimis outstanding letter of credit issued under the OMP Credit Facility.
Hedging Activity
The Company's crude oil contracts will settle monthly based on the average NYMEX West Texas Intermediate crude oil index price ("NYMEX WTI") for fixed price swaps and two-way and three-way costless collars. During 2Q20, the Company liquidated certain NYMEX WTI three-way costless collars for $25.3 million. As of August 5, 2020, the Company had the following outstanding commodity derivative contracts:
Related Categories :
Second Quarter (2Q) Update
More Second Quarter (2Q) Update News
-
Saturn Oil & Gas Second Quarter 2022 Results
-
Empire Petroleum Second Quarter 2022 Results
-
ProFrac Holding Corp. Second Quarter 2022 Results
-
InPlay Oil Corp. Second Quarter 2022 Results
-
Vermilion Energy Inc. Second Quarter 2022 Results
Rockies News >>>
-
Large E&P Chops Permian/Anadarko Basin Frac Activity by 30% In 2024

-
Contrary to The Noise, U.S. Oil Production will Likely Growth 4-5% In 2024; A look Inside -


-
Devon Said To be In Talks to Acquire Enerplus

-
Chevron To Cut D&C Activity in U.S. Shale In 2024; Here is Where. -

-
An Early Look at Company 2024 Capital & Development Plans


