
Quarterly / Earnings Reports | Third Quarter (3Q) Update | Capital Markets | Capital Expenditure | Drilling Activity | Capex Decrease | Capital Expenditure - 2019
QEP Touts Less Capex, More Wells, More Production

QEP Resources reported it's 3rd quarter results, and here is a quick read.
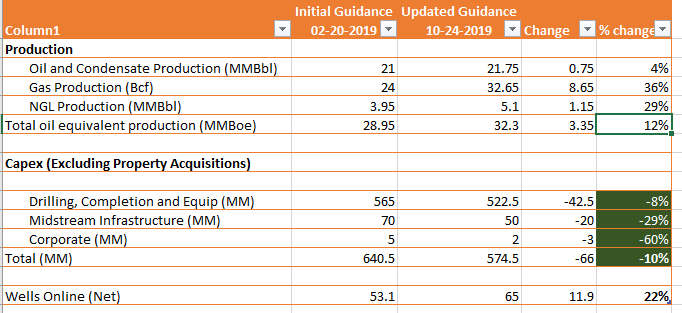
- 1. Reduced capital expenditure guidance by $65 million
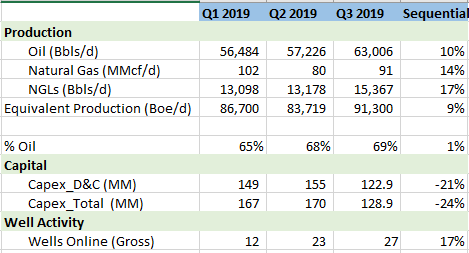
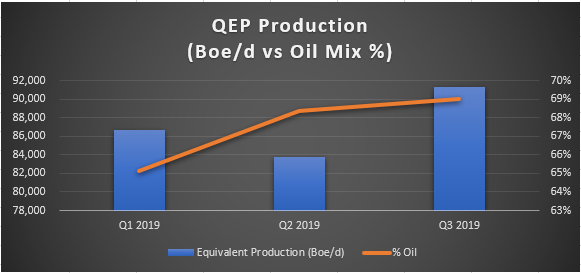
- 2. Production continues to grow, up 9% sequentially
- 3. Production getting oily, up from 65% in Q1 to 69% in Q3.
- 4. 58% of 2020 Production hedged at $58.21 per barrel.
- 5. Increased production guidance. We should note that this is being driven by the +22% increase in the number of wells the company plan on bringing online.
QEP Production Growth While Reducing Capex
Revised Guidance.
Production Growth as well as Oil Mix increasing.
"Operational performance in the third quarter exceeded expectations, with our core Permian Basin assets delivering record oil production. The outperformance of the Permian assets is directly attributable to the enhanced flowback and artificial lift strategy, along with improved frac to first production timing that we implemented earlier in the year. As a result, we have increased our annual production guidance for crude oil, natural gas and NGL and lowered the midpoint of CAPEX guidance by approximately $15 million compared to the second quarter," commented Tim Cutt, President and CEO of QEP.
"Our continued focus on reducing expenses has allowed us to lower the outlook for Lease Operating and G&A Expense. These tangible expense savings, coupled with the year-to-date reductions to drilling, completion and facility cost, resulted in QEP generating Free Cash Flow in the third quarter and positions the Company to generate significant Free Cash Flow in the fourth quarter. Our ability to generate significant Free Cash Flow on an annual basis going forward is expected to allow us to organically de-lever our balance sheet and return capital to shareholders."
The Company has posted to its website www.qepres.com a presentation that supplements the information provided in this release.
QEP Third Quarter 2019 Financial Results
The Company reported net income of $81.0 million for the third quarter 2019, or $0.34 per diluted share, compared with net income of $7.3 million, or $0.03 per diluted share, for the third quarter 2018. The Company's increase in net income in the third quarter of 2019 compared to 2018 was primarily due to an $87.4 million gain on realized and unrealized derivative contracts in the third quarter of 2019.
Net income includes non-cash gains and losses associated with the change in the fair value of derivative instruments, gains and losses from asset sales, asset impairments and certain other items. Excluding these items, the Company's third quarter 2019 Adjusted Net Income (a non-GAAP measure) was $11.0 million, or $0.05 per diluted share, compared to Adjusted Net Income of $39.6 million, or $0.17 per diluted share, for the third quarter 2018.
Adjusted EBITDA (a non-GAAP measure) for the third quarter 2019 was $193.5 million compared with $326.2 million for the third quarter 2018, primarily due to the Haynesville/Cotton Valley and Uinta Basin divestitures, lower equivalent production in the Williston Basin and a 16% decrease in average field-level oil prices, partially offset by an 18% increase in equivalent production in the Permian Basin, a $33.5 million decrease in realized derivative losses and an $18.7 million decrease in general and administrative expenses.
The definitions and reconciliations of Adjusted Net Income (Loss) to Net Income (Loss) and Adjusted EBITDA and Free Cash Flow are provided under the heading Non-GAAP measures at the end of this release.
Production
Oil equivalent production was 8.4 million barrels of oil equivalent (MMboe) in the third quarter 2019, a decrease of 42% compared with the third quarter 2018. The decrease in oil equivalent production was primarily the result of the loss of 5.2 MMboe (3% liquids) of equivalent production associated with the assets sold in the Haynesville/Cotton Valley and Uinta Basin divestitures.
Oil and condensate production in the Permian Basin was 4.0 million barrels (MMbbl) in the third quarter 2019, an increase of 12% compared with the third quarter of 2018, and a Company record. The production increase was offset by lower volumes in the Williston Basin due to a reduced level of activity in the third quarter of 2019 and a loss of volumes as a result of the Uinta Basin divestiture.
Operating Expenses
During the third quarter 2019, lease operating expense (LOE) was $38.3 million, a decrease of 41% compared with the third quarter 2018. The decrease is primarily due to the Haynesville/Cotton Valley and Uinta Basin divestitures. Excluding those divestitures, LOE decreased $14.1 million, driven by a decrease in maintenance and repair expenses, labor and water disposal in the Permian and Williston basins as a result of continuing efforts to reduce operating expenses.
During the third quarter of 2019, LOE was $4.56 per Boe, an increase of 2% compared to the third quarter of 2018, primarily due to the Haynesville/Cotton Valley and Uinta Basin divestitures. Excluding those divestitures, LOE per Boe decreased by 20% compared to the third quarter of 2018. The 20% decrease per BOE rate was related to lower cost production from the recent horizontal well completions in the Permian Basin, partially offset by decreased production in the Williston Basin.
During the third quarter 2019, Transportation and Processing (T&P) Costs were $18.0 million, a decrease of 36% compared with the third quarter 2018. Adjusted T&P Costs (a non-GAAP measure) were $32.2 million, a decrease of 26% compared with the third quarter 2018, primarily due to the Haynesville/Cotton Valley and Uinta Basin divestitures. Excluding those divestitures, Adjusted T&P Costs increased $5.2 million, primarily due to the recognition of $7.7 million of firm transportation expense related to future obligations in an area in which the Company no longer has production operations as well as increased production in the Permian Basin, partially offset by decreased production in the Williston Basin.
During the third quarter 2019, T&P Costs increased by $0.20 per Boe, or 10%, compared with the third quarter 2018. Adjusted T&P costs increased $0.79 per Boe, or 26%, during the third quarter of 2019 compared to the third quarter of 2018. The increase was primarily due to the recognition of $7.7 million of firm transportation expense related to future obligations in an area in which the Company no longer has production operations, partially offset by the Haynesville/Cotton Valley and Uinta Basin divestitures, which had higher adjusted transportation and processing costs per Boe.
The definition and reconciliation of Adjusted Transportation and Processing Costs is provided under the heading Non-GAAP Measures at the end of this release.
During the third quarter 2019, general and administrative (G&A) expense was $29.6 million, a decrease of 39% compared to the third quarter 2018. During the third quarter of 2019 and 2018, QEP incurred $10.0 million and $14.2 million, respectively, in costs associated with the implementation of our strategic initiatives, of which $10.4 million and $12.8 million, respectively, related to restructuring costs. Excluding these costs, G&A expense decreased by $14.4 million, or 42%, primarily due to $12.7 million lower labor, benefits and other associated costs due to the reduction in our workforce and $3.2 million in lower legal and outside service costs, partially offset by a $2.2 million decrease in overhead recoveries, primarily associated with our Haynesville/Cotton Valley and Uinta Basin divestitures. During the quarter the third quarter 2019, G&A was $3.52 per BOE.
During the third quarter 2019, production and property taxes were $20.0 million, a decrease of 47% compared to the third quarter 2018. The decrease in production and property taxes was primarily due to decreased revenues in the Williston Basin as well as the Haynesville/Cotton Valley and Uinta Basin divestitures.
During the third quarter of 2019, production and property taxes were $2.38 per Boe, a decrease of 8% compared to the third quarter of 2018, but decreased 35% excluding the Haynesville/Cotton Valley and Uinta Basin divestitures. The 35% decrease was due to a decrease in average field-level equivalent prices in the Permian and Williston basins.
Capital Investment
Capital investment, excluding property acquisitions, was $128.9 million (on an accrual basis) for the third quarter 2019, compared with $203.7 million for the third quarter 2018, of which $122.9 million related to the drilling, completion and equipping of wells and $6.0 million was related to midstream infrastructure investment. The decrease in capital expenditures was primarily related to a decrease in completion activity in the Permian Basin, partially offset by increased capital expenditures in the Williston Basin as the Company resumed drilling and completion activity in the basin.
Asset Divestitures
QEP closed on the sale of several assets during the third quarter 2019, including the corporate aircraft, for total net cash proceeds of approximately $9.8 million.
Liquidity
Net Cash Provided by Operating Activities for the third quarter 2019 was $146.3 million, compared with $298.0 million for the third quarter 2018. Free Cash Flow (a non-GAAP measure) was $17.5 million for the third quarter 2019, compared with $26.2 million for the third quarter 2018. Free Cash Flow was negative $66.9 million for the first three quarters of 2019 compared with negative $375.9 million for the first three quarters of 2018. Although the Company generated negative Free Cash Flow during the first three quarters of 2019, $676.5 million of proceeds was raised through the disposition of assets.
As of September 30, 2019, the Company had $92.4 million in cash and cash equivalents, no borrowings under its revolving credit facility and $2.9 million in letters of credit outstanding.
2019 Updated Guidance
QEP's fourth quarter and full year 2019 guidance assumes: (1) an oil price of $55 per barrel and a natural gas price of $2.50 per MMBtu, (2) that QEP will elect to recover ethane from its produced gas in the Permian Basin when processing economics support it, (3) no additional property acquisitions or divestitures, other than those already disclosed (4) includes approximately 10 days of production activity in the Haynesville/Cotton Valley and (5) includes the impact of lower flare volume and higher gas and NGL capture in the Permian Basin.
Rig Count:
- Permian Basin: average of three rigs for first half of 2019 and two rigs for the second half of 2019
- Williston Basin: one rig in the first quarter 2019 to drill seven gross operated wells
Wells Put on Production:
- Permian Basin: 59 net operated wells
- Williston Basin: six net operated wells
| 2019 Guidance | |||
| 4Q 2019 | 2019 | 2019 | |
| Guidance | Previous Guidance |
Updated Guidance |
|
| Oil & condensate production (MMbbl) | 5.7 - 6.0 | 21.0 - 21.5 | 21.6 - 21.9 |
| Gas production (Bcf) | 7.9 - 8.4 | 28.0 - 30.0 | 32.4 - 32.9 |
| NGL production (MMbbl) | 1.3 - 1.5 | 4.25 - 4.50 | 5.0 - 5.2 |
| Total oil equivalent production (MMboe) | 8.3 - 8.9 | 29.9 - 31.0 | 32.0 - 32.6 |
| Lease operating expense and Adjusted Transportation and Processing Costs (per Boe)(1) | $9.00 - $10.00 | $8.50 - $9.25 | |
| Depletion, depreciation and amortization (per Boe) | $16.75 - $17.75 | $16.75 - $17.75 | |
| Production and property taxes (% of field-level revenue) | 7.0% | 7.5% | |
| (in millions) | |||
| Total general and administrative expense(2) | $160.0 - $170.0 | $155.0 - $165.0 | |
| Less: Special general & administrative expense(3) | $54.0 | $54.0 | |
| Total General and administrative expense (excluding special general & administrative expense) | $106.0 - $116.0 | $101.0 - $111.0 | |
| Capital investment (excluding property acquisitions) | |||
| Drilling, Completion and Equipment (4) | $520.0 - $540.0 | $515.0 - $530.0 | |
| Midstream Infrastructure(5) | $55.0 | $50.0 | |
| Corporate | $5.0 | $2.0 | |
| Total capital investment (excluding property acquisitions) | $101.0 - $116.0 | $580.0 - $600.0 | $567.0 - $582.0 |
| Wells put on production (net) | 3 | 65 | 65 |
____________________________
(1) Adjusted Transportation and Processing Costs (per Boe) is a non-GAAP measure. Refer to Non-GAAP Measures at the end of this release.
(2) The mid-point of G&A expense includes approximately $26.0 million of expenses related to non-cash, share-based compensation and other mark-to-market liabilities. Because these mark-to-market liabilities fluctuate with stock price changes, the amount of actual expense may vary from the forecasted amount.
(3) Special G&A expense also includes approximately $54.0 million of estimated expenses associated with our strategic initiative process, primarily related to severance and retention programs, and includes approximately $11.0 million of accelerated shared-based compensation expense that is included in the $26.0 million of expenses related to non-cash, share-based compensation and other mark-to-market liabilities.
(4) Drilling, Completion and Equipment includes approximately $20.0 million of non-operated well costs.
(5) Includes capital expenditures in the Permian Basin associated with (a) water sourcing, gathering, recycling and disposal and (b) crude oil and natural gas gathering system.
Operations Summary
| Permian Basin | Williston Basin | ||||||||||
| As of September 30, 2019 | |||||||||||
| Gross | Net | Gross | Net | ||||||||
| Well Progress | |||||||||||
| Drilling | 7 | 7.0 | |||||||||
| At total depth - under drilling rig | 6 | 6.0 | |||||||||
| Waiting to be completed | 25 | 25.0 | |||||||||
| Completed, awaiting production | 4 | 3.4 | |||||||||
| Waiting on completion | 31 | 31.0 | 4 | 3.4 | |||||||
| Put on production(1) | 24 | 24.0 | 3 | 3.0 | |||||||
_______________________
(1) Total wells put on production during the three months ended September 30, 2019.
Permian Basin
Permian Basin net oil equivalent production averaged a Company record of approximately 61.5 Mboed (86% liquids) during the third quarter 2019, a 23% increase compared with the second quarter 2019 and an 18% increase compared with the third quarter 2018. Oil and condensate production in the Permian Basin was 4.0 MMbbl in the third quarter 2019, a 12% increase compared with the third quarter of 2018.
In the third quarter 2019, the Company put on production 24 gross-operated horizontal wells, all on Mustang Springs (average working interest 100%).
At the end of the third quarter 2019, of the 24 wells put on production during the quarter, 12 wells had reached peak production rates and 12 wells were still in the process of cleaning up. The wells put on production during the third quarter 2019 have an average lateral length of 8,631 feet.
At the end of the third quarter 2019, the Company had seven gross-operated horizontal wells in process of being drilled (of which five had surface casing set, but had no drilling rig present) (average working interest 100%), six horizontal wells at total depth under drilling rigs and 25 horizontal wells waiting to be completed (average working interest 100%).
At the end of the third quarter 2019, the Company had two operated rigs in the Permian Basin.
Williston Basin
Williston Basin net oil equivalent production averaged approximately 29.6 Mboed (80% liquids) during the third quarter 2019, a 9% decrease compared with the second quarter 2019 and a 38% decrease compared with the third quarter 2018, primarily due to a reduced level of activity.
During the third quarter 2019 the Company completed a seven well (gross) pad on South Antelope. During the last week of third quarter 2019 three wells (gross) of the seven wells (gross) were put on production. The remaining four wells (gross) were put on production in early October 2019.
At the end of the third quarter 2019, the Company had no drilling rigs in the Williston Basin.
Related Categories :
Third Quarter (3Q) Update
More Third Quarter (3Q) Update News
-
Evolution Petroleum Corporation Fiscal Third Quarter 2023 Results
-
Civitas Resources Third Quarter 2022 Results
-
Murphy Oil Third Quarter 2022 Results
-
ConocoPhillips Third Quarter 2022 Results
-
California Resources Third Quarter 2022 Results
Ark-La-Tex News >>>
-
Seventeen (17) E&Ps; To Use 47 Frac Crews To Complete 2,800 Wells In 2024

-
These Permian Operators Plan to Complete/Frac 2,100 Wells IN 2024

-
Large E&P Chops Permian/Anadarko Basin Frac Activity by 30% In 2024

-
Permian E&P Ups 2024 Well Completed by +27% vs. 2023

-
Contrary to The Noise, U.S. Oil Production will Likely Growth 4-5% In 2024; A look Inside -


