WS Atkins plc Preliminary results for the year ended 31 March 2015 11 June 2015 1
Uwe Krueger Chief executive officer 2
Delivering the strategy Progressing towards the 8% margin goal Financial highlights Organic, constant currency revenue up 4.6% Underlying operating profit up 15.2%, improved margin of 7.6% Underlying diluted EPS up 13.3%, full year…
Heath Drewett Group finance director 4
Financial summary 2015 2014 Revenue 1,757 m 1,750 m 0.4 % Operating profit 118.5 m 113.7 m 4.2 % Operating margin 6.7 % 6.5 % 20 bp Underlying operating profit 134.1 m 116.4 m 15.2 % Underlying operating margin 7.6 % 6.7 % 90…
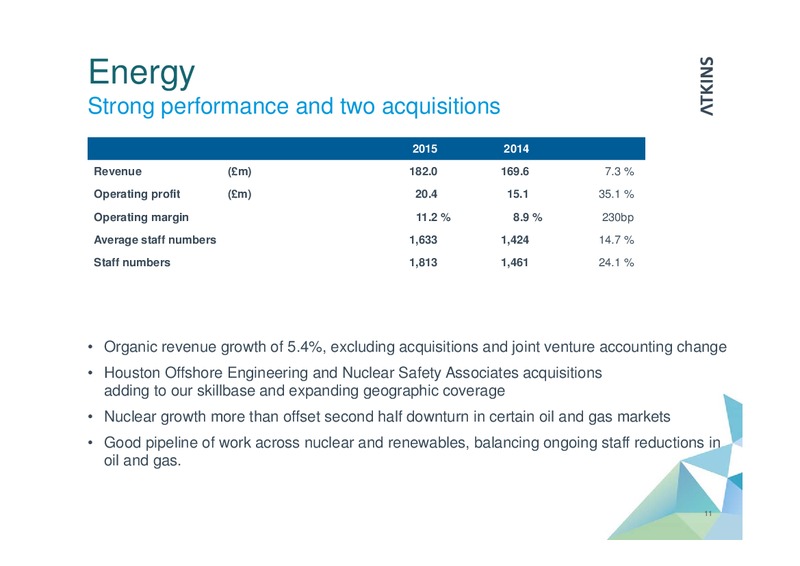
Energy Strong performance and two acquisitions 2015 2014 Revenue (m) 182.0 169.6 7.3 % Operating profit (m) 20.4 15.1 35.1 % Operating margin 11.2 % 8.9 % 230bp Average staff numbers 1,633 1,424 14.7 % Staff numbers 1,813 1,461 24.1…
Cash flow Strong performance (m) 2015 2014 Underlying operating profit 134.1 116.4 Depreciation/amortisation 22.4 19.5 Working capital 11.3 (9.6) Net capital expenditure (25.2) (16.9) Provisions/other 11.5 1.2 Underlying operating…
Pension Asset performance mitigates discount rate fall 238m IAS 19 deficit net of IAS19 deficit net of deferred tax (m) deferred tax at 31 March 2015 (March 2014: 258m) Strong asset performance and 342 liability hedging offsetting…
Summary Delivering the strategy Good results, improved margin and a strong cash performance Focus on three pillar strategy continues Outlook for 2015/16 is for continued underlying growth and performance in line with…
Uwe Krueger Chief executive officer 15
Strategic progress Financial delivery Three pillar strategy is working: operational excellence, portfolio optimisation and sector/regional focus Operational excellence centres on margin improvement and cash generation Actions to…
Capital allocation Key priorities Reinvest Acquisitions Progressive for organic in line with dividend growth our strategy policy SE Asia HOE Full year dividend Technology NSA up 8.1% Partnerships Terramar Client…
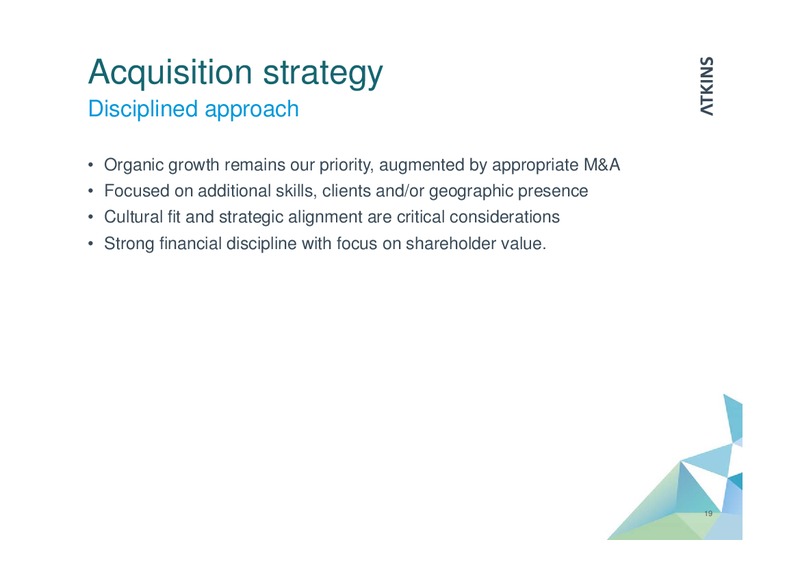
Acquisition strategy Disciplined approach Organic growth remains our priority, augmented by appropriate M&A Focused on additional skills, clients and/or geographic presence Cultural fit and strategic alignment are critical…
Looking forward 20
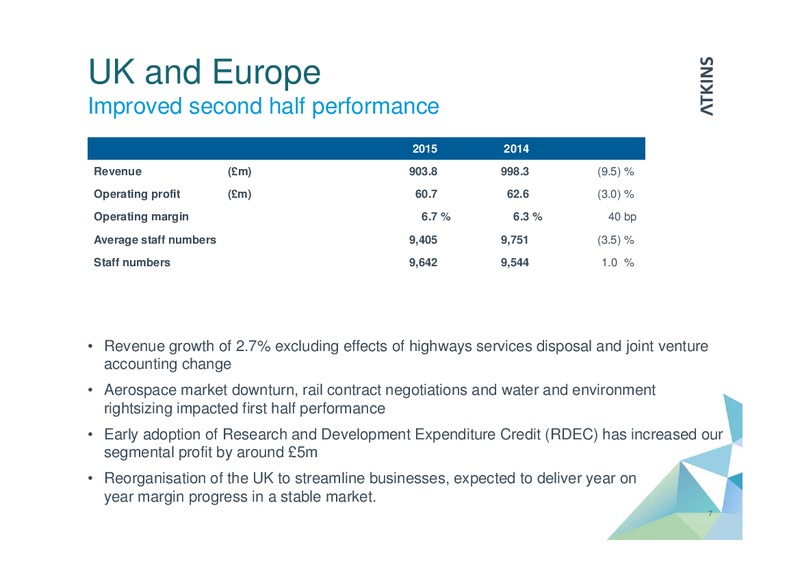
UK and Europe Market drivers Ongoing Government support for UK infrastructure spend. National Infrastructure Plan 2014 supported by an investment pipeline of 460bn Well funded markets in rail, roads, water, airports and education…
North America Market drivers Economic recovery creating demand for infrastructure Ageing legacy assets investment growth expected after prolonged period of underfunding Long term Federal funding uncertainty Our priorities Focused…
Middle East Market drivers Energy-rich Governments pushing for economic diversification Growing populations and social expectations requiring transport infrastructure and creation of world-class cities Our priorities Deliver on…
Asia Pacific Market drivers Acceleration and scale of urbanisation drives unprecedented infrastructure spend Significant lack of infrastructure in SE Asia and limited funding resources demand cost effective solutions Outbound…
Energy Market drivers Population and income growth for both developing and developed nations Strengthening consensus on the need to address climate change via nuclear, renewables and prioritising gas over oil development Our…
Innovation and technology 26
Our people Diverse Board Women account for 30% of promotions in the UK UK and Europe improved gender diversity to over 25% Over 40% of vacancies in Asia Pacific were filled by women Women account for over 50% of graduate engineers in…
Summary Delivering the strategy Our strategy is delivering through: operational excellence portfolio optimisation sector/regional focus Objective to deliver profitable growth by addressing strategic priorities in our selected…
Appendices 29
Profit bridge Underlying profit before tax 2.2 0.4 121.9 6.9 12.7 1.5 114.2 4.4 10.5 5.0 2.8 2.7 106.4 106.7 2013/14 Profit on Amortisation 2013/14 RDEC Business Other 2014/15 Profit on Amortisation Deferred Transaction…
Segmental summary Operating m Revenue Operating margin profit/(loss) UK and Europe 904 60.7 6.7 % North America 341 20.0 5.9 % Middle East 217 22.5 10.4 % Asia Pacific 110 9.8 8.9 % Energy 182 20.4 11.2 % Total for segments 1,754…
UK and Europe UK 2015 2014 Revenue (m) 835.6 922.0 (9.4) % Operating profit (m) 59.4 58.1 2.2 % Operating margin 7.1 % 6.3 % 80 bp Average staff numbers 8,675 9,017 (3.8) % Staff numbers 8,885 8,810 0.9 % Europe 2015 2014 Revenue…
Working capital movement Regional lock-up m 2015 2014 Inc/(Dec) Lock-up UK and Europe 72.4 87.1 (14.7) North America 86.3 69.4 16.9 Middle East 56.6 67.3 (10.7) Other (net) 23.1 2.9 20.2 Total 238.4 226.7 11.7 33
 Loading...