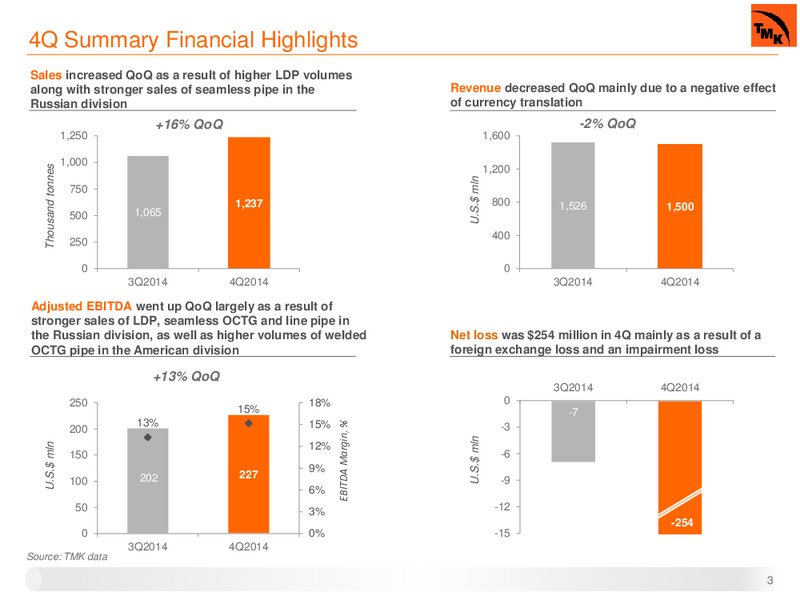
4Q Summary Financial Highlights Sales increased QoQ as a result of higher LDP volumes along with stronger sales of seamless pipe in the Revenue decreased QoQ mainly due to a negative effect Russian division of currency translation +16%…
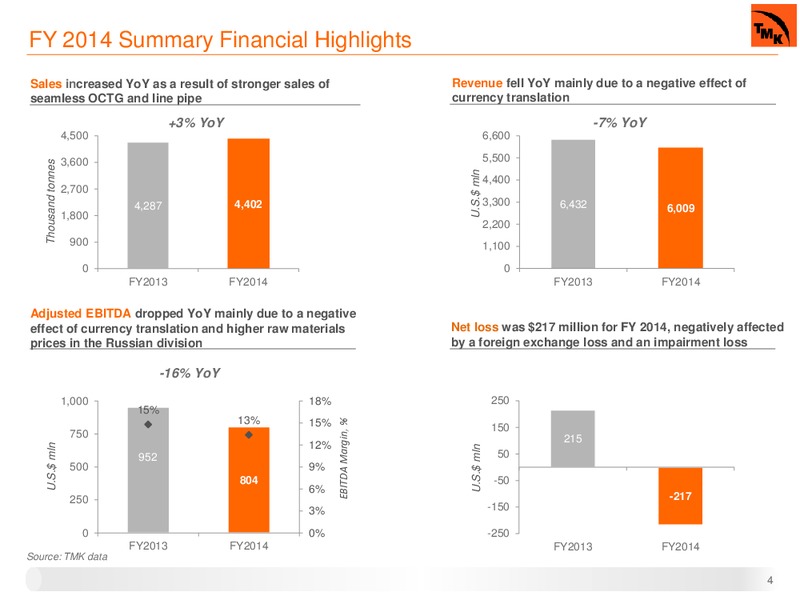
FY 2014 Summary Financial Highlights Sales increased YoY as a result of stronger sales of Revenue fell YoY mainly due to a negative effect of seamless OCTG and line pipe currency translation +3% YoY -7% YoY 4,500 6,600 3,600 5,500…
Recent Developments Seamless capacity addition In October 2014, TMK put into operation a new FQM pipe rolling mill at Seversky pipe plant with a total production capacity of around 600 thousand tonnes. As a result, incremental increase…
Russian Market Overview Growing oil drilling market in Russia Key considerations 12 In 4Q2014, the Russian pipe market increased by 5% 11 QoQ. For FY2014, the Russian pipe market rose by 9% 10 YoY. Such growth in both periods was…
US Market Overview Growing oil drilling activity Key considerations US Oil and Gas Rig Count 2,100 Gas According to Baker Hughes, in 4Q2014, the average 1,800 Oil rig count remained relatively flat QoQ. For FY2014, the Gas 22%…
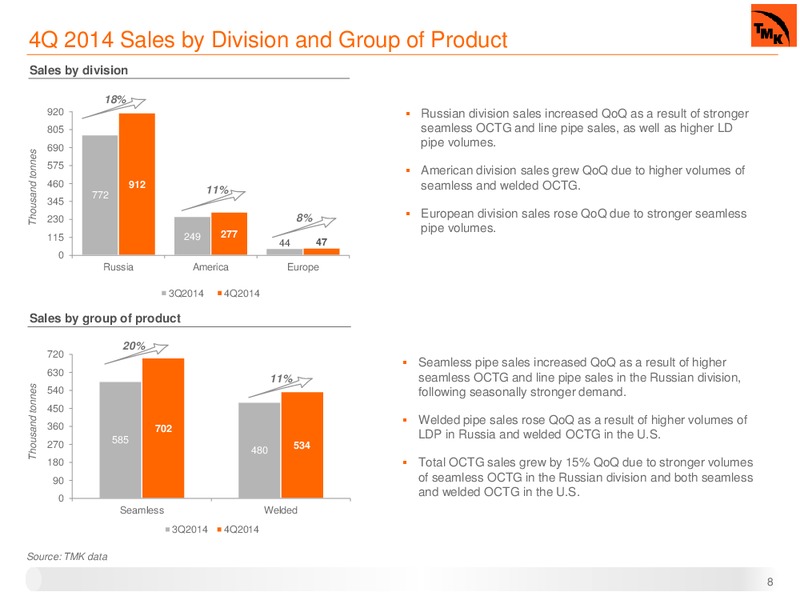
4Q 2014 Sales by Division and Group of Product Sales by division 18% 920 Russian division sales increased QoQ as a result of stronger 805 seamless OCTG and line pipe sales, as well as higher LD 690 pipe volumes. Thousand tonnes…
4Q 2014 Revenue by Division Revenue Revenue per tonne* 1,200 1,800 0% -6% 1,000 1,500 -21% -8% 800 1,200 U.S. / tonne U.S. mln 600 12% 900 1,775 1,775 1,014 948 1,312 1,346 400 600 1,240 1,040 441 492 -17% 300…
4Q 2014 Adjusted EBITDA by Division Adjusted EBITDA Adjusted EBITDA margin 180 7% 20% 17% 150 15% 15% 13% 120 12% U.S. mln 11% % 9% 90 10% 162 151 41% 60 5% 30 -33% 42 59 9 6 0 0% Russia America Europe…
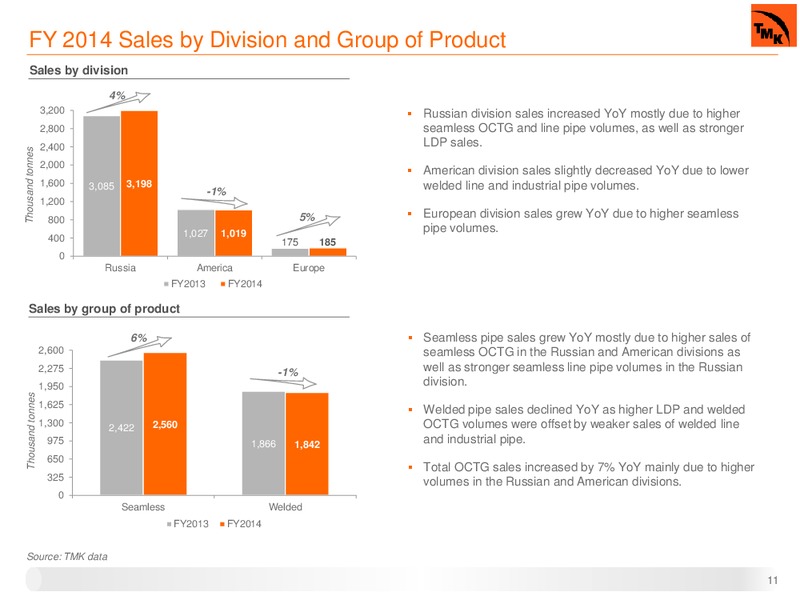
FY 2014 Sales by Division and Group of Product Sales by division 4% 3,200 Russian division sales increased YoY mostly due to higher 2,800 seamless OCTG and line pipe volumes, as well as stronger 2,400 LDP sales. Thousand…
FY 2014 Revenue by Division Revenue Revenue per tonne* -11% 7% 4,800 1,800 -15% 4,000 14% 1,350 3,200 U.S. / tonne U.S. mln 2,400 900 1,733 4,483 6% 1,621 3,973 1,453 1,600 1,242 1,286 1,127 450 -5% 800 1,665…
FY 2014 Adjusted EBITDA by Division Adjusted EBITDA Adjusted EBITDA margin -21% 800 20% 17% 15% 16% 600 12% U.S. mln 12% 11% % 400 776 9% 9% 614 8% 10% 200 3% 4% 145 159 31 32 0 0% Russia America Europe Russia…
Seamless Core to Profitability QoQ, YoY, FY 2014 gross profit breakdown U.S. mln 4Q 2014 FY 2014 (unless stated otherwise) % % Other 702 2,560 operations Volumes- Pipes, kt 20% 6% 2% Revenue 883 3,748 Welded -4% -5% 20%…
Working Capital Position as of December 31, 2014 Inventories (days) Accounts payable (days) 100 80 97 75 96 73 73 66 64 91 90 90 89 60 80 40 2010 2011 2012 2013 2014 2010 2011 2012 2013 2014 Accounts receivable (days)…
Debt Maturity Profile as of December 31, 2014 As of December 31, 2014, total 800 financial debt amounted to U.S.3,223 mln. 76% of total financial debt is long- 600 term. 311 Redeemed Feb 2015 Convertible Bonds using cash…
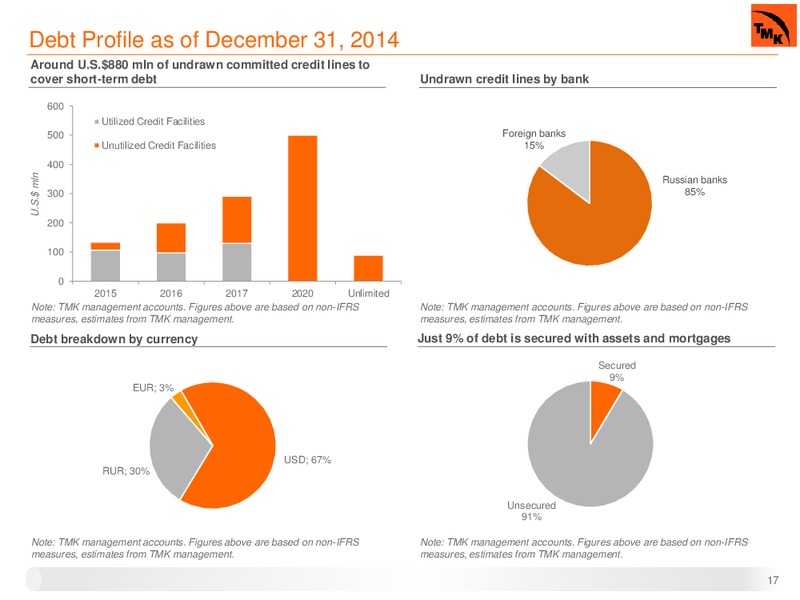
Debt Profile as of December 31, 2014 Around U.S.880 mln of undrawn committed credit lines to cover short-term debt Undrawn credit lines by bank 600 Utilized Credit Facilities 500 Foreign banks Unutilized Credit Facilities 15% 400…
Outlook In 1Q2015, TMK observes a high utilization rate of its production facilities in Russia, due to seasonally stronger demand from the oil and gas majors and greater pipeline construction activity. TMK already increased prices to the…
Thank You TMK Investor Relations 40/2a, Pokrovka Street, Moscow, 105062, Russia +7 (495) 775-7600 IRtmk-group.com 19
 Loading...