Royal Vopak Half Year 2017 18 August 2017 Analyst presentation Results
Chairman of the Executive Board and CEO of Royal Vopak Eelco Hoekstra
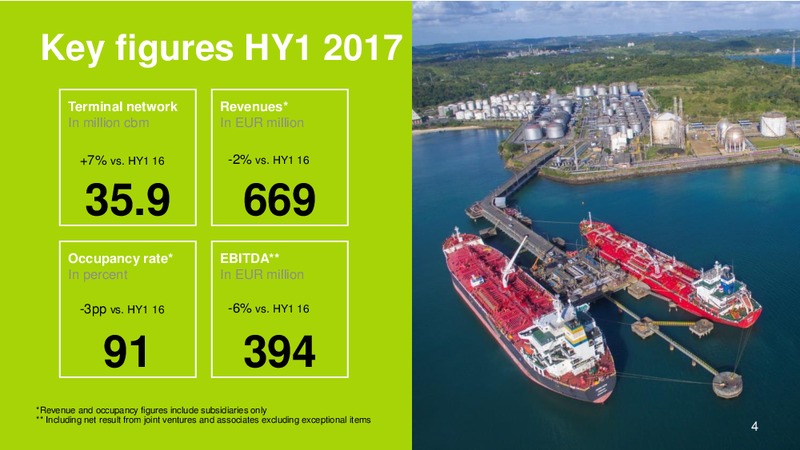
Key figures HY1 2017 Terminal network Revenues* In million cbm In EUR million +7% vs. HY1 16 -2% vs. HY1 16 35.9 669 Occupancy rate* EBITDA** In percent In EUR million -3pp vs. HY1 16 -6% vs. HY1 16 91 394 *Revenue and…
Product-market developments HY1 2017 Different developments per geographic region Crude oil Structural flows crude oil Vegoils Positive vegoils market in & oil products & biofuels the Netherlands and Americas Healthy demand gasoline…
Events and topics in HY1 Growth Cost projects competitiveness Successful FID new projects In line with the 2017-2019 and announcement of strategic direction we want to feasibility study strengthen our competitive position Total capacity…
Safety performance Total Injury Rate (TIR) Lost Time Injury Rate (LTIR) Total injuries per 200,000 hours worked by Total injuries leading to lost time per 200,000 hours own employees and contractors worked by own employees and…
Summary key messages Results in the Netherlands are below expectations, results for EMEA, Asia and LNG are in line with outlook, while the Americas results are above PERFORMANCE expectations HY1 2017 EBITDA -excl. exceptional items-…
Vice-Chairman of the Executive Board and CFO Jack of Royal Vopak De Kreij
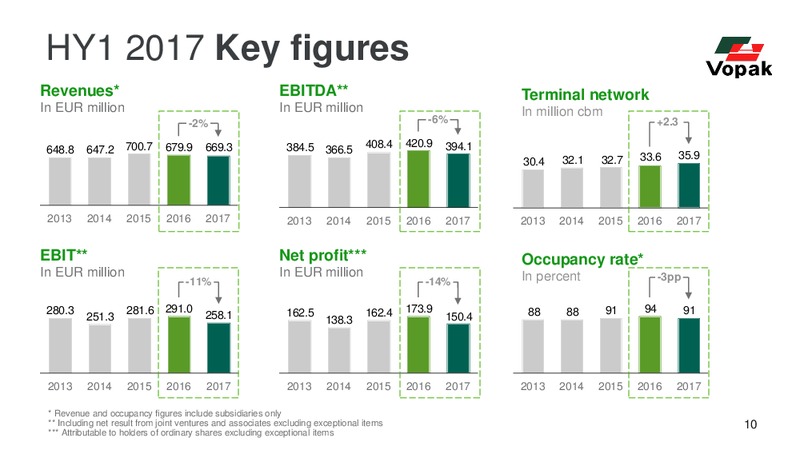
HY1 2017 Key figures Revenues* EBITDA** Terminal network In EUR million In EUR million In million cbm -2% -6% +2.3 408.4 420.9 648.8 647.2 700.7 679.9 669.3 384.5 366.5 394.1 35.9 30.4 32.1 32.7 33.6 2013 2014 2015 2016 2017…
HY1 2017 Segmented EBITDA Netherlands EMEA Results in the Netherlands are In EUR million In EUR million below expectations, the results 148.0 68.4 65.1 62.7 119.4 123.7 137.2 122.4 57.0 55.0 for EMEA, Asia and LNG are in line with…
EBIT to Net profit analysis HY1 2017 HY1 2016 EBITDA 394.1 420.9 Depreciation and amortization 136.0 129.9 EBIT 258.1 291.0 Profit before income tax 52.3 55.9 Income tax 33.8 38.7 Income tax HY1 2017: Lower compared to the…
Financial flexibility The solid operational cash flow generation, strong balance sheet and sufficient financial flexibility, provides an excellent platform to continue our long-term focused capital disciplined growth journey Senior net…
Storage capacity developments The timely completion of the current projects under construction, of which, most are backed by commercial storage contracts will contribute to the aimed for EBITDA growth and positive EPS development in the…
Capital commitments Total investments 2005-2019 Expansion capex*** In EUR million In EUR million; 100% = EUR 2,500 million Forecasted capex 2,012 1,899 Remaining 1,729 New projects* 700 Vopak share in capex (Group capex and…
Margin development Efficiency program to reduce Vopaks future cost base with at least EUR 25 million by 2019 is well underway 60 EBITDA margin 50 EBIT margin 40 30 20 10 2004 2005 2006 2007 2008 2009 2010 2011 2012 2013 2014…
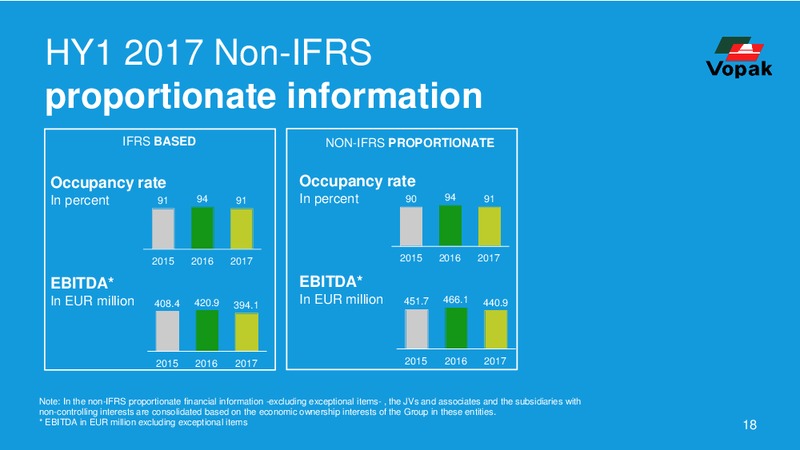
HY1 2017 Non-IFRS proportionate information IFRS BASED NON-IFRS PROPORTIONATE Occupancy rate Occupancy rate In percent 91 94 91 In percent 90 94 91 2015 2016 2017 2015 2016 2017 EBITDA* EBITDA* In EUR million 408.4 420.9…
Looking ahead Supported by solid operational cash flow generation, a strong balance sheet and sufficient financial flexibility, Vopak will continue its capital disciplined long-term growth journey, while maintaining on average a Cash…
Outlook 2017 For 2017, we expect to realize an average occupancy rate of around 90% (2016: 93%). Taking into account the lower occupancy rates, additional costs related to investments in growth and technology, the missing contribution…
The worlds leading independent tank storage company building Questions on an impressive history of more & answers than 400 years
Royal Vopak 18 August 2017 Half year 2017 Analyst presentation appendix
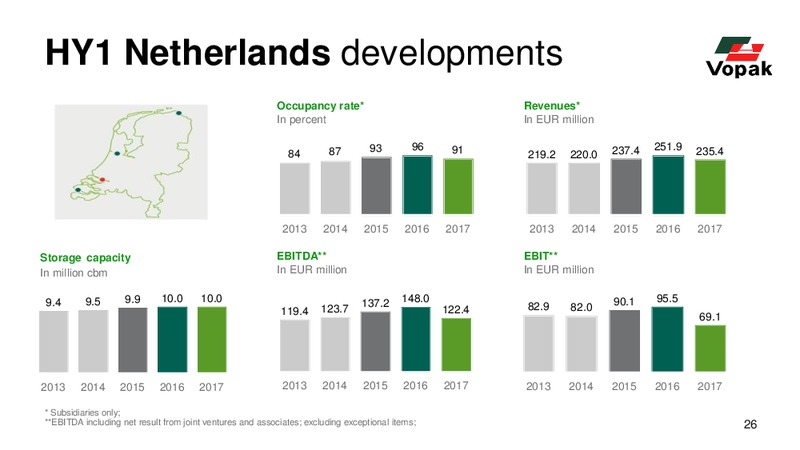
HY1 Netherlands developments Occupancy rate* Revenues* In percent In EUR million 87 93 96 91 237.4 251.9 235.4 84 219.2 220.0 2013 2014 2015 2016 2017 2013 2014 2015 2016 2017 Storage capacity EBITDA** EBIT** In million cbm In…
HY1 EMEA developments Occupancy rate* Revenues* In percent In EUR million 89 91 95 92 126.9 135.1 81 119.8 101.5 89.0 2013 2014 2015 2016 2017 2013 2014 2015 2016 2017 Storage capacity EBITDA** EBIT** In million cbm In EUR…
HY1 Asia developments Occupancy rate* Revenues* In percent In EUR million 95 95 88 92 90 182.3 177.6 193.0 191.9 194.1 2013 2014 2015 2016 2017 2013 2014 2015 2016 2017 Storage capacity EBITDA** EBIT** In million cbm In EUR…
HY1 Americas developments Occupancy rate* Revenues* In percent In EUR million 90 91 90 92 90 149.9 124.3 134.4 134.1 119.4 2013 2014 2015 2016 2017 2013 2014 2015 2016 2017 Storage capacity EBITDA** EBIT** In million cbm In…
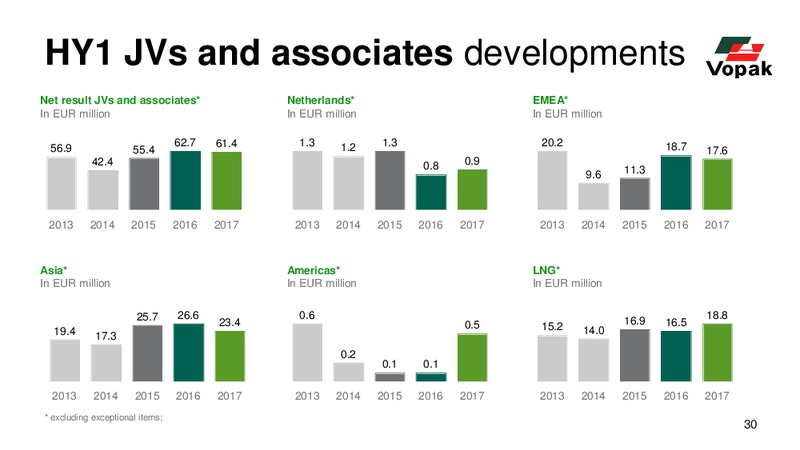
HY1 JVs and associates developments Net result JVs and associates* Netherlands* EMEA* In EUR million In EUR million In EUR million 62.7 61.4 1.3 1.2 1.3 20.2 18.7 56.9 55.4 17.6 42.4 0.8 0.9 9.6 11.3 2013 2014 2015 2016 2017…
Royal Vopak 18 August 2017 Half year 2017 Analyst presentation results
For more information please contact: Media contact: Liesbeth Lans, Manager External Communications Telephone: +31 (0)10 400 2777, e-mail: global.communicationvopak.com Investor Relations contact: Anil Acardag, Manager Investor Relations…
 Loading...