financial results year ended 30 June 2019. 21 August 2019
results overview and strategic results overview and highlights strategic highlights Rob Wheals Managing Director and CEO. 3
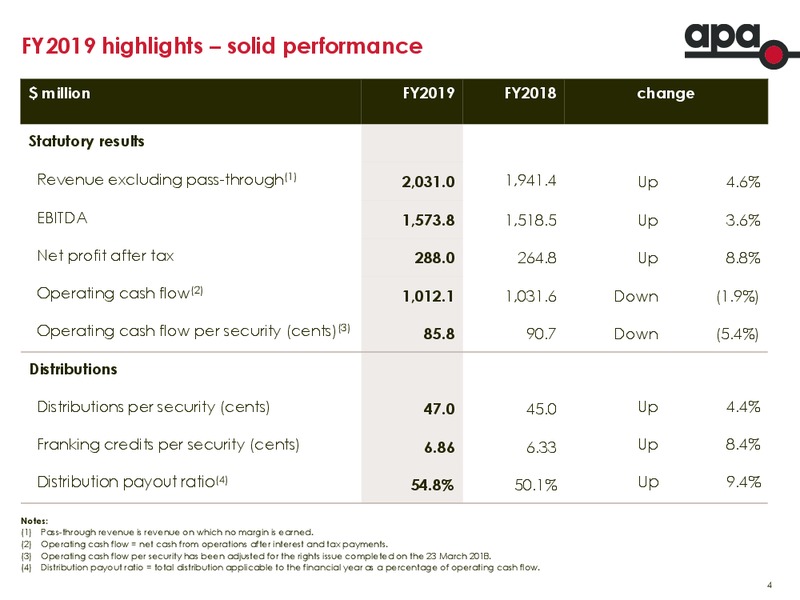
FY2019 highlights solid performance million FY2019 FY2018 change Statutory results Revenue excluding pass-through(1) 2,031.0 1,941.4 Up 4.6% EBITDA 1,573.8 1,518.5 Up 3.6% Net profit after tax 288.0 264.8 Up 8.8% Operating…
safety and sustainability Health and safety Sustainability FY2019 TRIFR result 5.98 APA believes that climate change is a significant issue facing the energy industry and the Australian community 33.1% improvement on FY2018 Natural…
customer focus & The Energy Charter putting customers at the centre of our decision-making APAs Customer Promise Customer Promise developed and launched Multi-year improvement program to: Drive the right culture Deliver improvement…
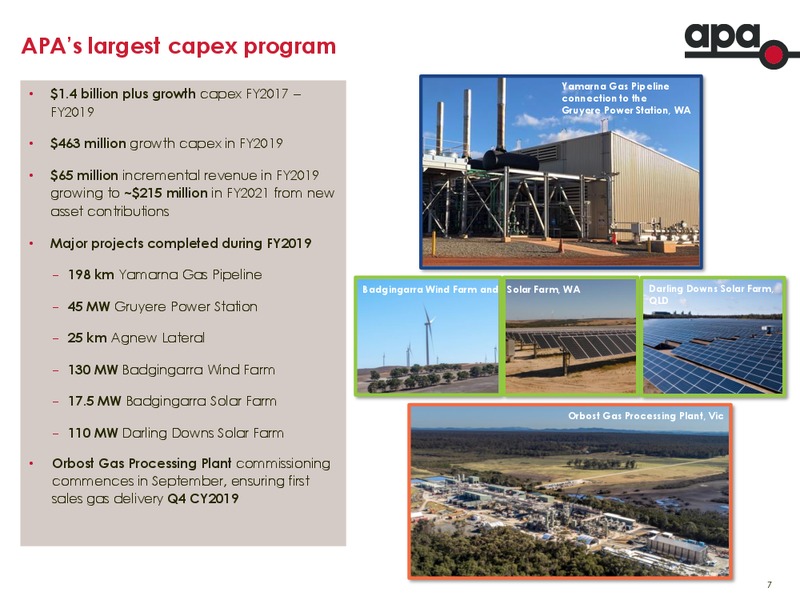
APAs largest capex program Yamarna Gas Pipeline 1.4 billion plus growth capex FY2017 connection to the FY2019 Gruyere Power Station, WA 463 million growth capex in FY2019 65 million incremental revenue in FY2019 growing to 215…
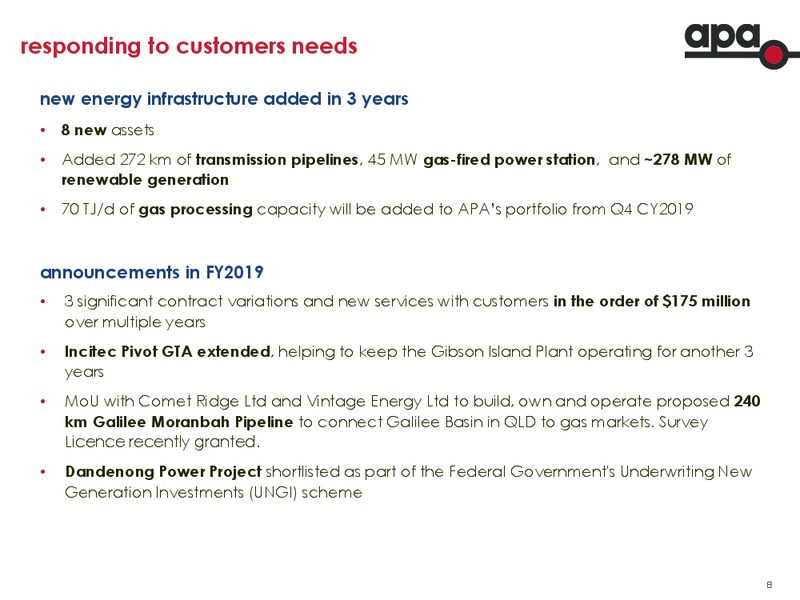
responding to customers needs new energy infrastructure added in 3 years 8 new assets Added 272 km of transmission pipelines, 45 MW gas-fired power station, and 278 MW of renewable generation 70 TJ/d of gas processing capacity will…
financial results overview and performance strategic highlights Peter Fredricson Chief Financial Officer. 9
summary results million FY2019 FY2018 Change APA made the following Revenue excluding contributions to the 2,031.0 1,941.4 4.6% pass-through(1) broader economy EBITDA 1,573.8 1,518.5 3.6% during FY2019: Depreciation and…
FY2019 result: EBITDA by business segment % of FY19 million FY2019 FY2018 Change EBITDA(1) Energy Infrastructure Queensland 1,010.1 962.2 5.0% 61.1% New South Wales 149.4 147.1 1.5% 9.0% Victoria & South Australia 116.0 127.2…
low risk business model APA has robust risk management processes in place Manage counterparty risks by: Diversification of customer & industry exposure Assessment of counterparty creditworthiness Putting in place appropriate…
capital expenditure million FY2019 FY2018 Growth capex 462.8 million in FY2019 Growth capex (FY2018: 742.9 million) Regulated Victoria 30.6 33.0 Expected 300-400 million per annum over the next Non-regulated two to three years East…
capital management Credit ratings: S&P BBB (outlook Stable, affirmed Nov 2018) Moodys Baa2 (outlook Stable, affirmed Feb 2019) Strong credit metrics provide balance sheet flexibility All outstanding debt is fully hedged into fixed…
debt maturity profile APA maintains diversity of funding sources and spread of maturities(1) 1,600m Headroom (undrawn committed facilities) Bank borrowings 1,400m Sterling MTN 1,200m Euro MTN US 144A Notes 1,000m Japanese…
fully covered distributions FY2019 distribution payout ratio(1) of 54.8% Franking Credits Components for FY2019 final distribution: 71.8 million tax payable for FY2019 8.53 cents APT profit distribution (FY2018: 52.0 million) 10.44…
strategy results overview andand outlook strategic highlights Rob Wheals Managing Director and CEO. 18
APAs strategy East coast gas demand & production by field Deliver services our customers value consistent with APAs Customer Promise Contingent and Prospectives 2,500PJ 2P Undeveloped 2P Developed Continue to strengthen asset and…
energy infrastructure contracting Pipeline recontracting ongoing: Number of renewed firm service contracts 60 No formal access requests which may trigger arbitration process 50 Since the GMRG reforms (1 Aug 2017) were 40…
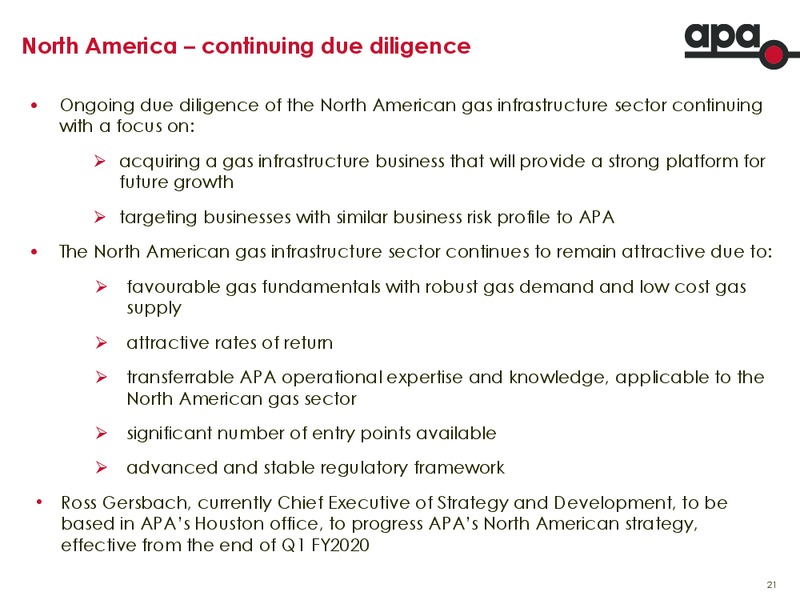
North America continuing due diligence Ongoing due diligence of the North American gas infrastructure sector continuing with a focus on: acquiring a gas infrastructure business that will provide a strong platform for future growth…
FY2020 guidance Based on current operating plans and available information: EBITDA is expected to be in the range of 1,660 million to 1,690 million Net interest costs are expected within a range of 505 million to 515 million…
priorities for FY2020 complete review of APAs purpose, vision and strategic imperatives implement new organisational model to support strategy execution progress APAs growth strategy, both organic in Australia, and possible US…
APAs uniquely integrated energy infrastructure Assets and Investments Glossary AGPGLOS Amadeus Gas Pipeline AL Agnew Lateral Darwin WPP BGP Bonaparte Gas Pipeline 783 PJ BWSF Badgingarra Wind and Solar Farms BGP BWP Berwyndale…
FY2019 operational summary Energy Infrastructure Wallumbilla Gladstone Pipeline South West Queensland Pipeline Roma Brisbane Pipeline Carpentaria Gas Pipeline Diamantina Power Station Darling Downs Solar Farm Other Qld assets Moomba…
historical normalised EBITDA by asset Energy Infrastructure millions FY15 FY16 FY17 FY18 FY19 East Coast Grid Wallumbilla Gladstone Pipeline 35.8 475.2 488.0 515.9 542.4 South West Queensland Pipeline 188.3 240.3 242.4 244.3 250.0…
Asset Management and Energy Investments Asset Management EBITDA Asset Management A 70 m EBITDA decreased to 53.0 million due to lower 60 customer contributions and incentive fees One-off Customer compared to FY2018 50…
Corporate costs Corporate costs have been steady throughout a record growth period for APA A m 1,800 10% 1,600 8% 1,400 1,200 6% 1,000 (1) 800 (2) 4% 600 400 2% 200 0 0% FY14 FY15 FY16 FY17 FY18 FY19…
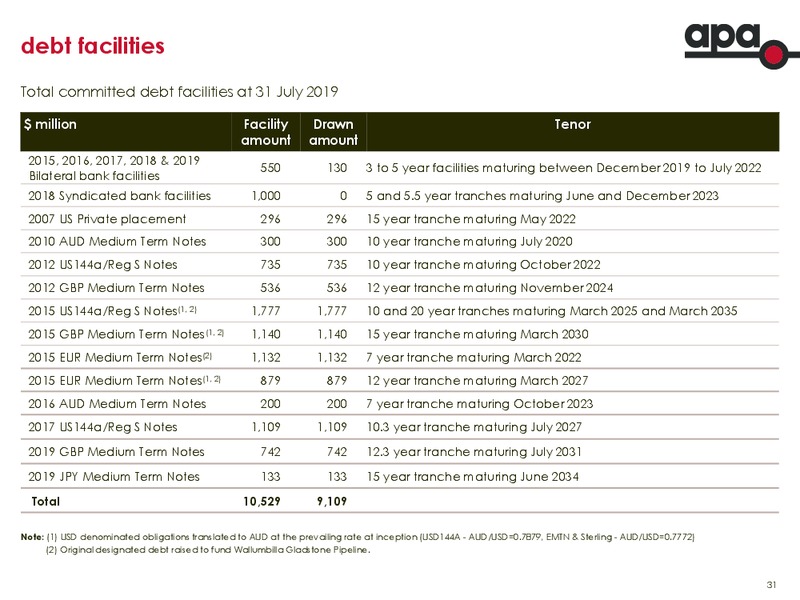
debt facilities Total committed debt facilities at 31 July 2019 million Facility Drawn Tenor amount amount 2015, 2016, 2017, 2018 & 2019 550 130 3 to 5 year facilities maturing between December 2019 to July 2022 Bilateral bank…
For further information contact: Jennifer Blake Group Head of Investor Relations Tel: +61 2 9693 0097 / +61 455 071 006 E-mail: jennifer.blakeapa.com.au Or visit the APA website at: www.apa.com.au 32
 Loading...