Agenda Re-assessment of outlook and financial implications Merger update Financial results Summary 3
Re-assessment of outlook and financial implications Market outlook Financial implications A prolonged downturn and weaker Re-assessment of market outlook outlook in the North Sea in particular impacts cash-flow projections in the years…
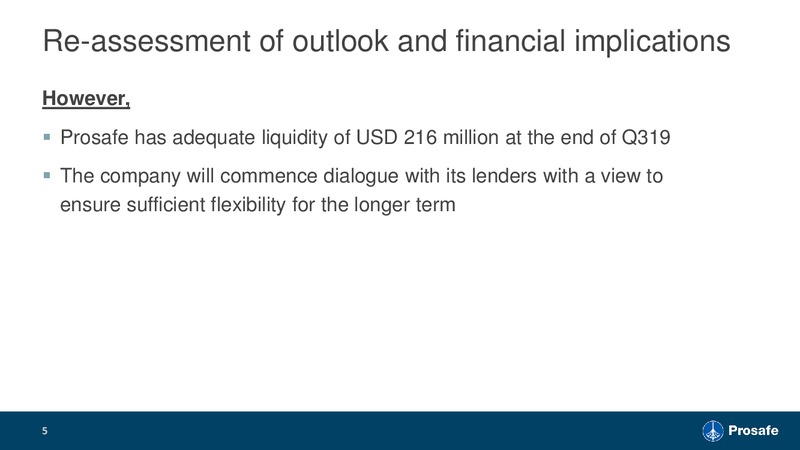
Re-assessment of outlook and financial implications However, Prosafe has adequate liquidity of USD 216 million at the end of Q319 The company will commence dialogue with its lenders with a view to ensure sufficient flexibility for the…
Agenda Re-assessment of outlook and financial implications Merger update Financial results Summary 6
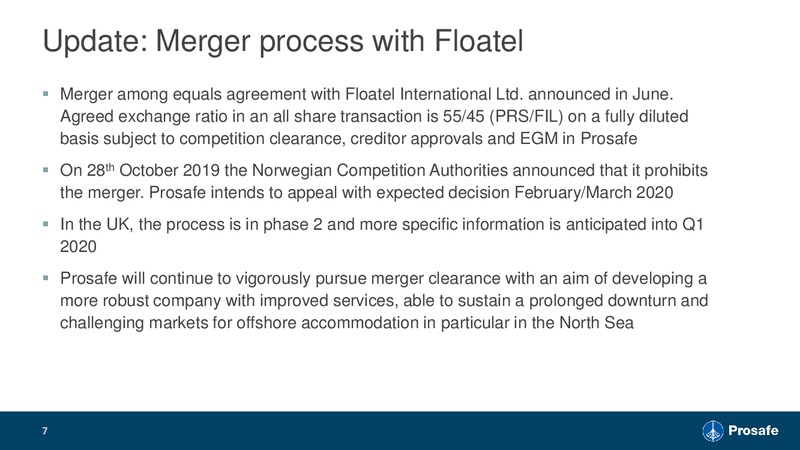
Update: Merger process with Floatel Merger among equals agreement with Floatel International Ltd. announced in June. Agreed exchange ratio in an all share transaction is 55/45 (PRS/FIL) on a fully diluted basis subject to competition…
Agenda Re-assessment of outlook and financial implications Merger update Financial results Summary 8
Q3 2019 in short Utilisation of 48.2% (48.1% in Q3 2018) Order backlog is USD 170 million per Q3 2019 Financial results Reported EBITDA was USD 26.3 million. Underlying EBITDA in the quarter adjusted for non-recurring items was USD…
Fleet status: Contracts, wins and extensions Contract backlog Contracting update Safe Caledonia contracted by Total UK for 162 days from mid-April 2020 with a 30-day option. Subsequently, Safe Zephyrus will conduct the Shearwater…
Streamlining and cash preservation The company is in process of further reducing its organisation in response to the reduced and volatile activity level Continued efforts to streamline operating costs and lay-up situations as well as…
Income statement (Unaudited figures in USD million) Q3 19 Q3 18 Impairments of USD 341 million as a result of re- assessment of market outlook Operating revenues 57 74 Operating expenses (30) (42) Fleet utilisation at 48.2% (Q3 2018:…
Balance sheet (Unaudited figures in USD million) 30.09.19 30.06.19 30.09.18 Vessels 1,016 1,379 1,451 Total assets of USD 1.5 billion. New builds 259 149 126 Other non-current assets 3 3 16 Rigs impaired by USD 341 million Total…
Agenda Re-assessment of outlook and financial implications Merger update Financial results Summary 15
Summary EBITDA of USD 26.1 million in the quarter Re-assessment of market outlook and consequent impairments of USD 341 million Sufficient liquidity of USD 216 million The company will initiate dialogue with lenders The company is…
Appendix 17
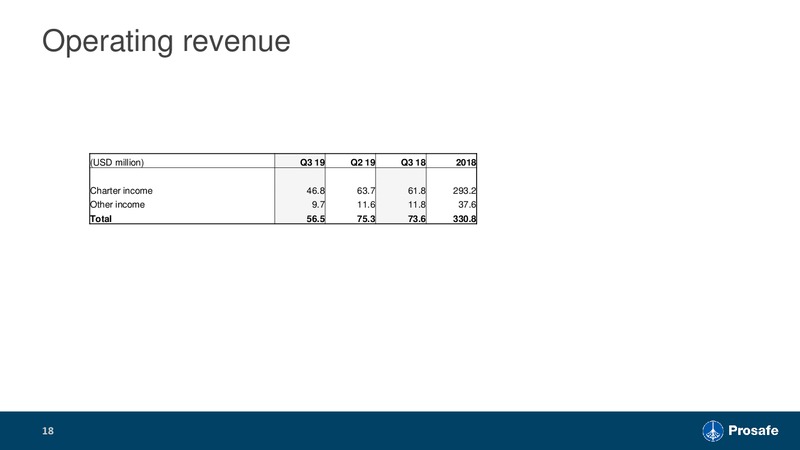
Operating revenue (USD million) Q3 19 Q2 19 Q3 18 2018 Charter income 46.8 63.7 61.8 293.2 Other income 9.7 11.6 11.8 37.6 Total 56.5 75.3 73.6 330.8 18
 Loading...