Eagle Ford Shale A Road Map to the Eagle Ford MANUJ NIKHANJ VICE-PRESIDENT
WHO IS ROSS SMITH ENERGY GROUP North Americas Leading Independent Oil and Gas Research Firm Established 12 Years Ago 30+ Employees Staffed Similar to an E&P Company Engineers, Engineering Technologists, Financial Analysts,…
EAGLE FORD SHALE PRESENTATION TOPICS Characterization of the Eagle Ford Stratigraphic location and shale characteristics Depth and high prospectivity area Gas, gas-condensate and oil fairways Thickness Activity Company acreage…
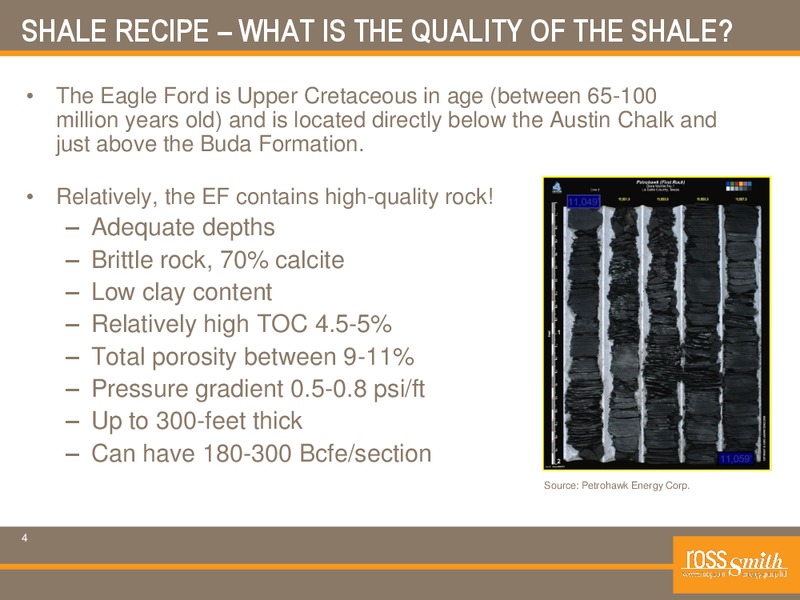
SHALE RECIPE WHAT IS THE QUALITY OF THE SHALE The Eagle Ford is Upper Cretaceous in age (between 65-100 million years old) and is located directly below the Austin Chalk and just above the Buda Formation. Relatively, the EF contains…
DEPTH AND CHARACTERIZATION OF THE EAGLE FORD Source: Company reports, HPDI, RSEG 5
EAGLE FORD GAS, GAS-CONDENSATE AND OIL FAIRWAYS Source: HPDI, RSEG 6
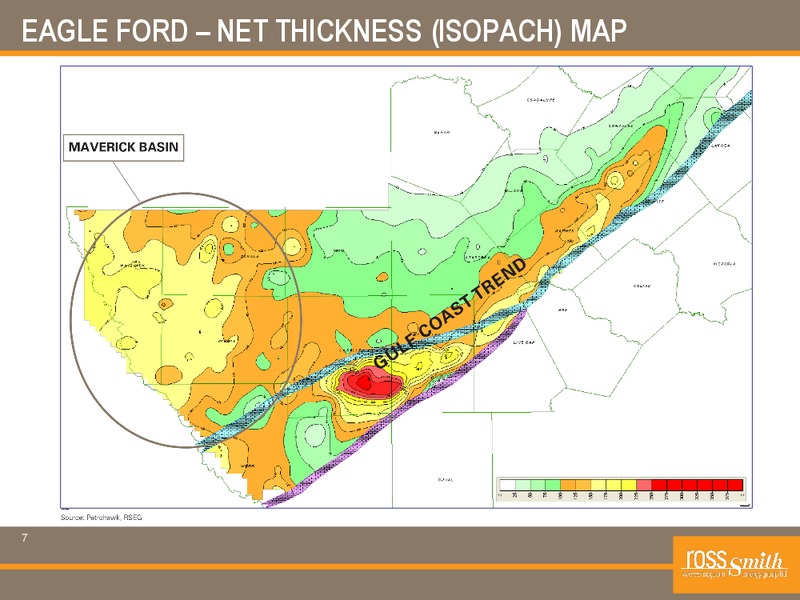
EAGLE FORD NET THICKNESS (ISOPACH) MAP 7
EAGLE FORD ESTIMATED ACREAGE OUTLINES Source: Company reports, HPDI, RSEG 8
EAGLE FORD RIG COUNT Source: Company reports, HPDI, RSEG 9
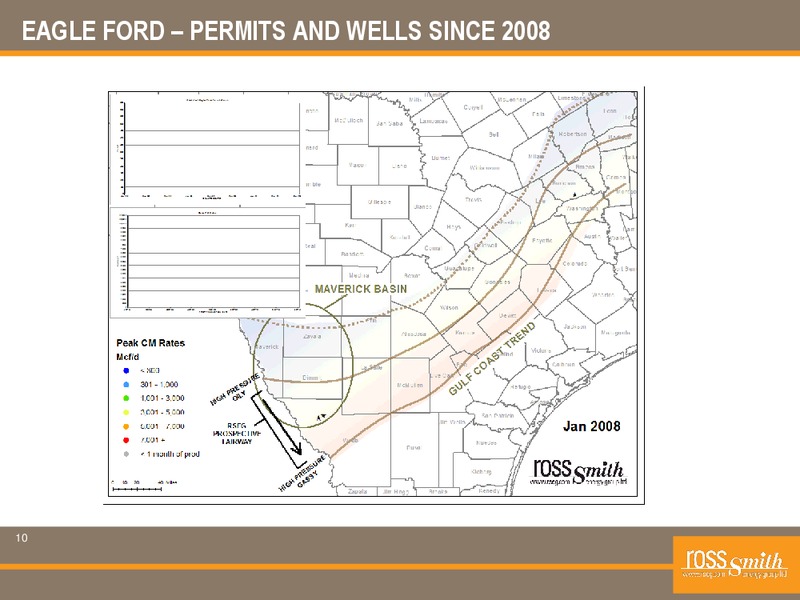
EAGLE FORD PERMITS AND WELLS SINCE 2008 10
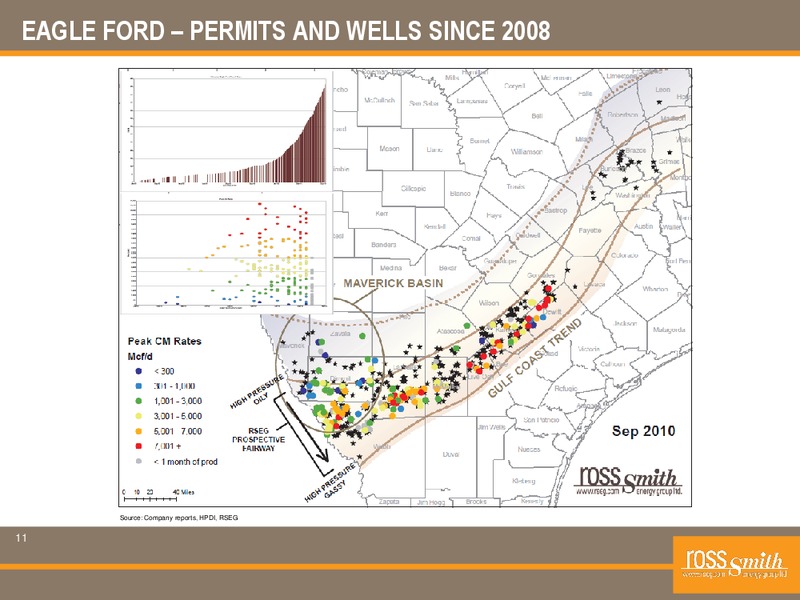
EAGLE FORD PERMITS AND WELLS SINCE 2008 Source: Company reports, HPDI, RSEG 11
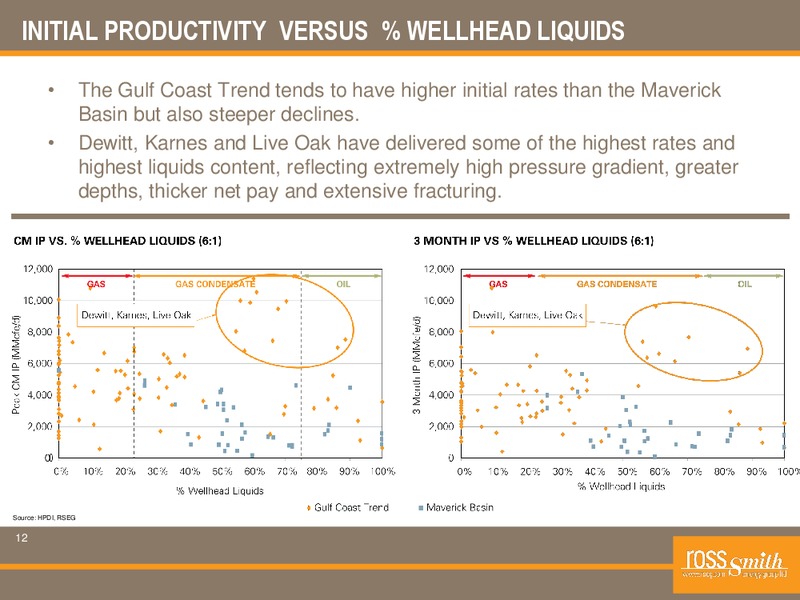
INITIAL PRODUCTIVITY VERSUS % WELLHEAD LIQUIDS The Gulf Coast Trend tends to have higher initial rates than the Maverick Basin but also steeper declines. Dewitt, Karnes and Live Oak have delivered some of the highest rates and…
WELL PERFORMANCE BY AREA Source: Company reports, HPDI, RSEG 13
WELL PERFORMANCE - DRY AND LEAN CONDENSATE - (0-23% Wellhead Liquids) Source: Company reports, HPDI, RSEG 14
WELL PERFORMANCE - RICH CONDENSATE - (24-75% Wellhead Liquids) 15
OIL FAIRWAY USING EOG DISCLOSURES (75% Wellhead Liquids) WEST EAST 16
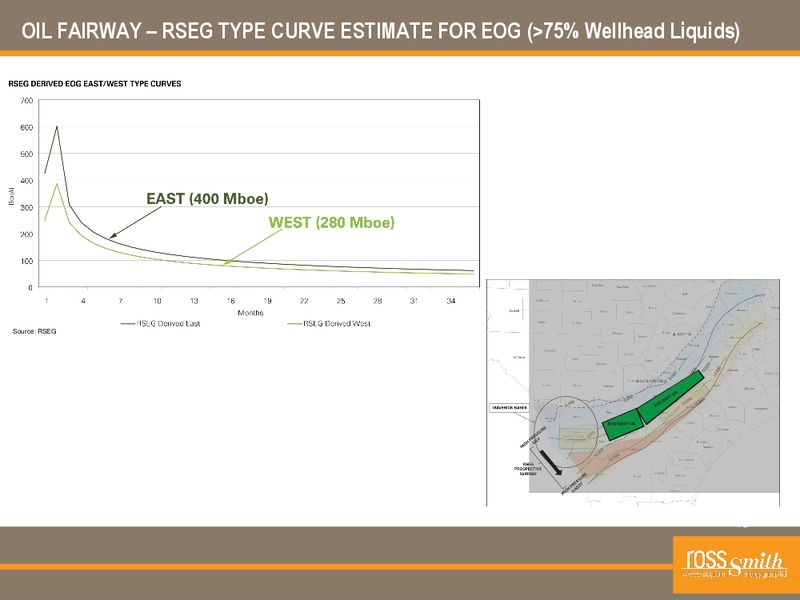
OIL FAIRWAY USING EOG DISCLOSURES (75% Wellhead Liquids) EOG expects post-processing recoveries of 318 Mboe and 481 Mboe for its West and East EF acreage, respectively. By digitizing EOGs data and comparing the information to IPs and…
OIL FAIRWAY RSEG TYPE CURVE ESTIMATE FOR EOG (75% Wellhead Liquids) Source: RSEG 18
RELATIVE COMPARISON TYPE CURVES AND DECLINES 19
GENERIC ECONOMICS SINGLE-WELL MODEL 20
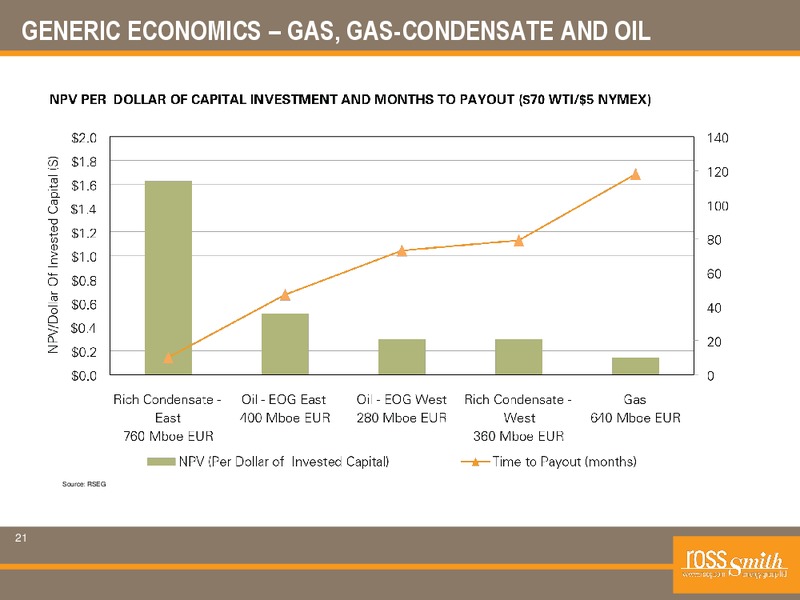
GENERIC ECONOMICS GAS, GAS-CONDENSATE AND OIL Source: RSEG 21
PEAK CALENDAR-MONTH RATES BY COUNTY (6:1) 22
PEAK CALENDAR-MONTH RATES BY OPERATOR (6:1) 23
WHERE DOES THE EF CURRENTLY SIT ON THE COST CURVE 24
EAGLE FORD SUMMARY The shales thermal maturity changes very rapidly. There are areas that are gassy and those that are oily. Economics are industry leading but it matters where you are. Generally, the rich gas-condensate fairway in…
 Loading...