Q1 2004 Results Increase of net profit y-o-y 14 May 2004
Full use made of positive refinery market conditions z The highest net profit in the companys history* - PLN 397 m z ROACE 13.7%** WACC 8.9% z PLN 143 m savings in Q1 04 due to cost cutting programme z Increase in wholesale volume by…
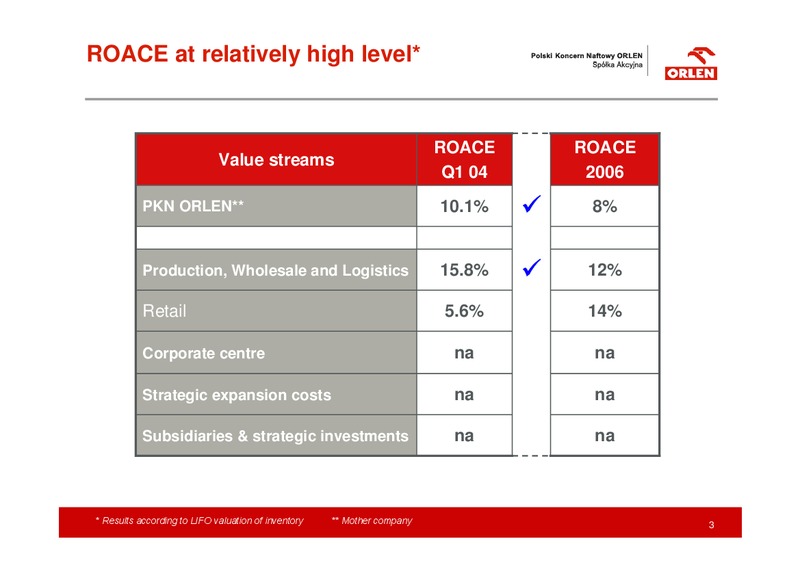
ROACE at relatively high level* ROACE ROACE Value streams Q1 04 2006 PKN ORLEN** 10.1% 9 8% Production, Wholesale and Logistics 15.8% 9 12% Retail 5.6% 14% Corporate centre na na Strategic expansion costs na na…
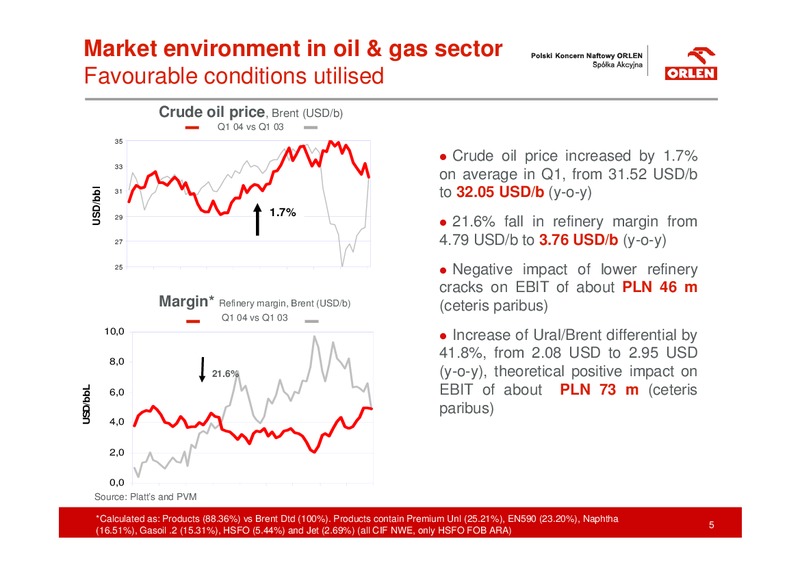
Market environment in oil & gas sector Favourable conditions utilised Crude oil price, Brent (USD/b) Q1 04 vs Q1 03 35 z Crude oil price increased by 1.7% 33 on average in Q1, from 31.52 USD/b USD/bbl 31 to 32.05 USD/b…
Market environment Poland Noticeable recovery in the economy Real GDP growth 5.6E% 6% z Visible increase of GDP proves stable 5% economic recovery. High 4% unemployment rate continues 20.5% 3% (fall of 0.1pp y-o-y vs. increase of…
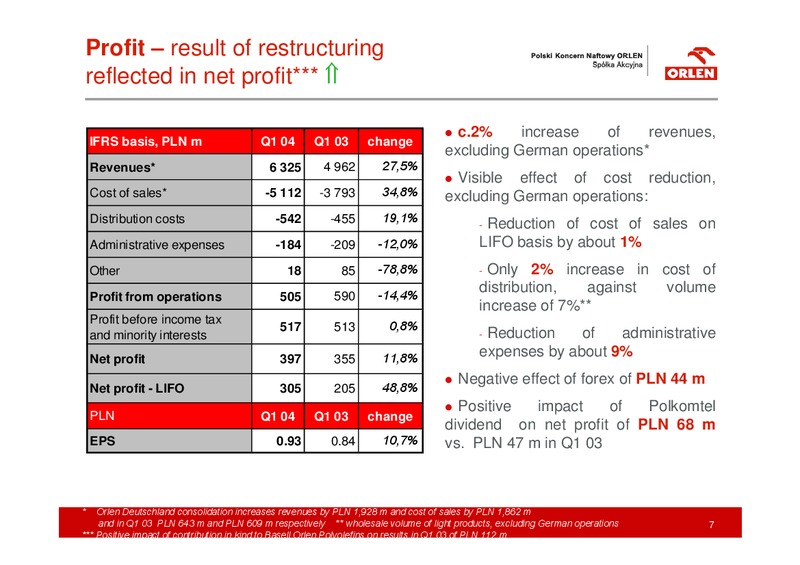
Profit result of restructuring reflected in net profit*** z c.2% increase of revenues, IFRS basis, PLN m Q1 04 Q1 03 change excluding German operations* Revenues* 6 325 4 962 27,5% z Visible effect of cost reduction, Cost of…
Operating CF organic CAPEX Proper cash flow management Operating CF Sale of assets PLN 22 m PLN 604 m Decrease in 135% debt PLN 181 m Purchase of * assets Dividend and PLN 11 m interest PLN 19 m 90 80 Organic 70 60 R&M…
Consequent quarter of satisfactory profitability in refinery segment Refining and wholesale z Recovery in domestic fuel IFRS basis, PLN m Q1 04 Q1 03 change consumption Revenue 3 958 3 942 0,4% Total costs z Increase of light…
Seasonality of retail sales visible in segments profit Retail IFRS basis, PLN m Q1 04 Q1 03 change z Total volume of sales increased by Revenue 2 478 1 695 46,2% 18.2%, mainly due to consolidation of Total costs German operation 2…
High profitability Fertilizer market recovery Petrochemicals z After excluding positive effect IFRS basis, PLN m Q1 04 Q1 03 change of in kind contribution to BOP Revenue 1 270 1 257 1,0% result in Q1 03, performance was Total…
Supporting slides Cost cutting programme 12
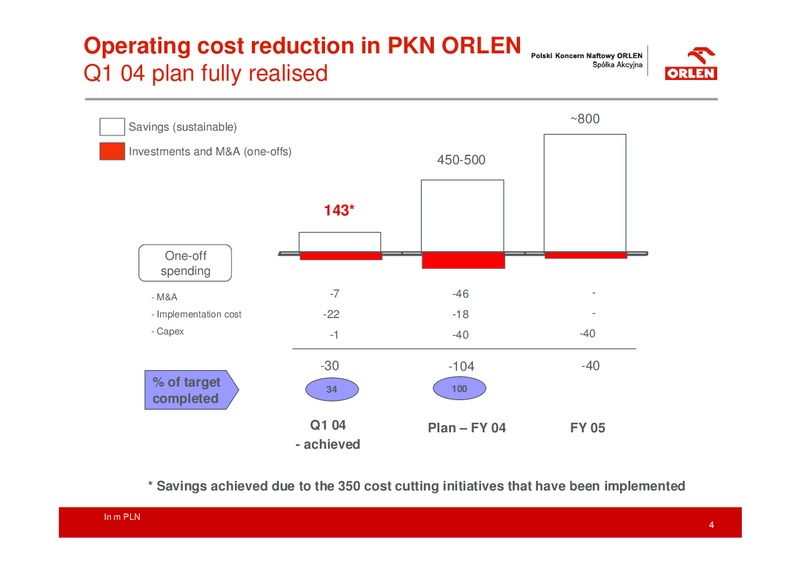
Positive influence of cost cutting programme on Q1 04 results In PLN m PLN 143 m 7 32 22 59 114 52 Savings Implementation Savings on Production & Logistics M&A EBIT level in and sales achieved in costs Technology Q1…
Supporting slides ORLEN Deutschland 14
Orlen Deutschland Q1 04 performance and plans for 2004 Q1 04 trends: Fuel margin in Q1 04 was much lower compared to Q1 03 due to tough competition and the increase in oil prices since the beginning of the year Sales volumes are…
ORLEN Deutschland Financial highlights Q1 04 Balance sheets - selected items (PLN m) Q1 04 Orlen Deutschland Property, plant and equipment 807 Inventories 128 Trade and other receivables 310 Cash and cach equivalents 368 Total…
Supporting slides Other data 17
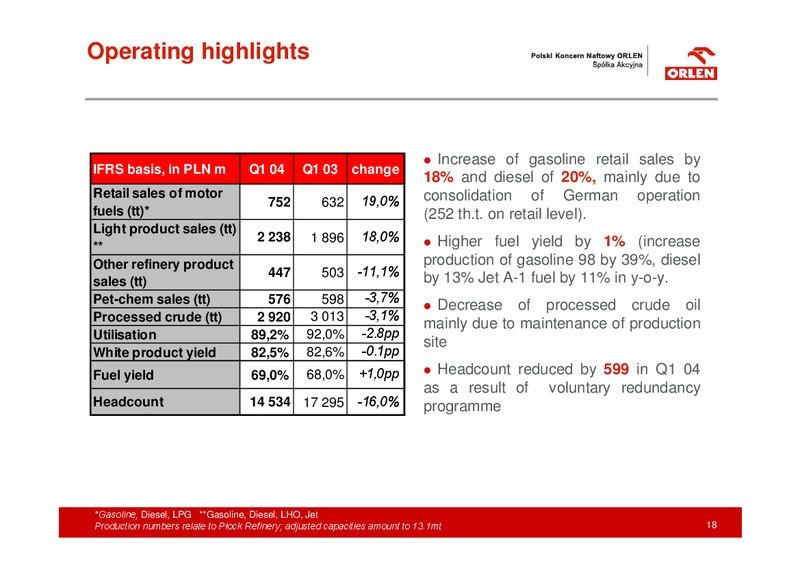
Operating highlights z Increase of gasoline retail sales by IFRS basis, in PLN m Q1 04 Q1 03 change 18% and diesel of 20%, mainly due to Retail sales of motor consolidation of German operation 752 632 19,0% fuels (tt)* (252 th.t. on…
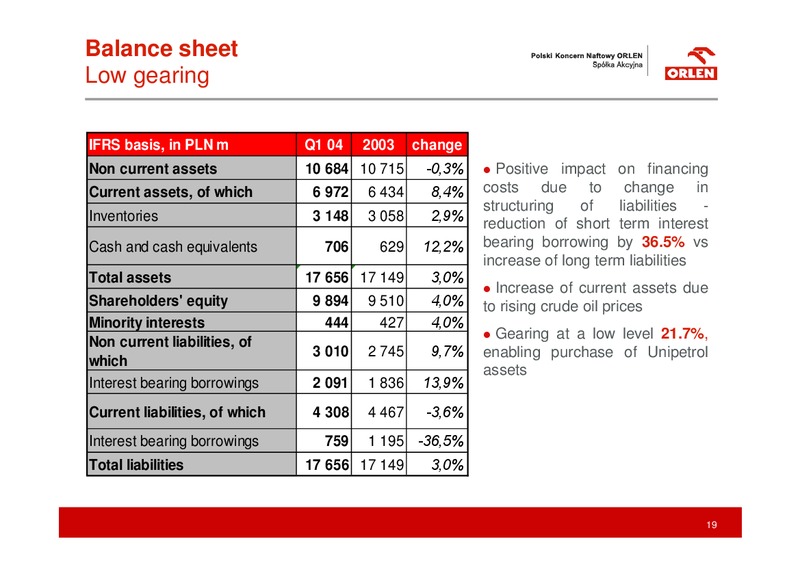
Balance sheet Low gearing IFRS basis, in PLN m Q1 04 2003 change Non current assets 10 684 10 715 -0,3% z Positive impact on financing Current assets, of which 6 972 6 434 8,4% costs due to change in structuring of liabilities -…
 Loading...