Agenda 9 AM Welcome David Rosenthal Vice President, Investor Relations Corporate Rex Tillerson Chairman and CEO Upstream Mark Albers Senior Vice President Andy Swiger Senior Vice President Downstream Don Humphreys Senior…
Corporate Overview Rex Tillerson Chairman and CEO
2009 Results ExxonMobil delivered strong results during a year of significant challenges. Industry-leading safety performance Solid financial performance Earnings 19.3 B ROCE 16 % Cash flow from operations and asset sales 30 B…
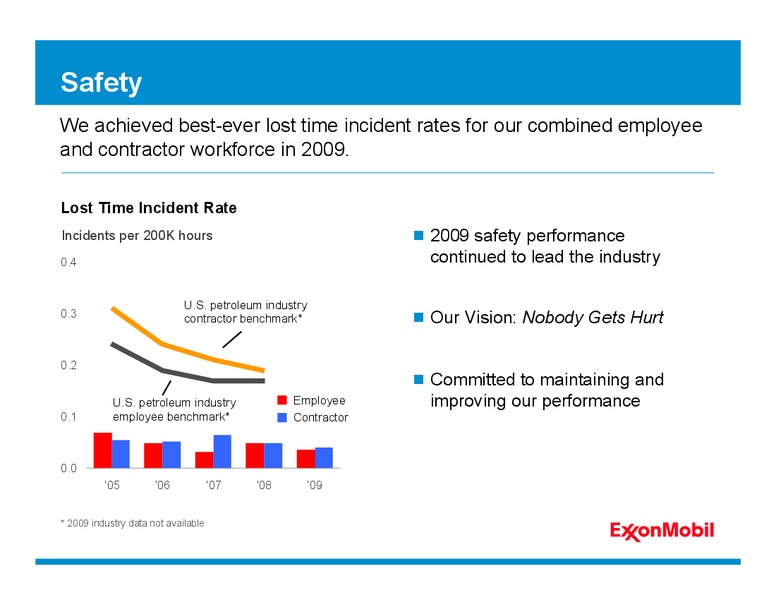
Safety We achieved best-ever lost time incident rates for our combined employee and contractor workforce in 2009. Lost Time Incident Rate Incidents per 200K hours 2009 safety performance 0.4 continued to lead the industry U.S.…
Environmental Performance We are committed to reducing our impact on the environment while expanding energy supplies needed to fuel economic growth. Hydrocarbon Flaring from Upstream Oil and Gas Production Strong environmental…
Earnings ExxonMobil earned 19.3 billion in 2009 during a period of volatile and challenging industry conditions. Earnings Excluding Special Items B Upstream Industry-leading results in 50 Downstream all business segments Chemical…
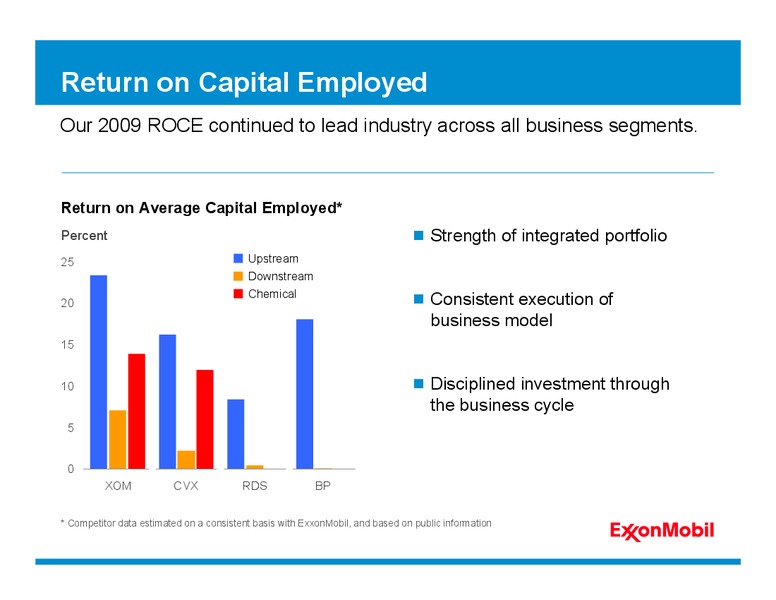
Return on Capital Employed Our 2009 ROCE continued to lead industry across all business segments. Return on Average Capital Employed* Percent Strength of integrated portfolio 25 Upstream Downstream Chemical 20 Consistent execution…
Cash Flow Strong cash flows underpin our investment plans and shareholder distributions. Cash Flow from Operating Activities* B 28.4 billion in 2009 60 50 Reduction in-line with lower 40 commodity prices and margins 30 Funded all…
Capex We invested record levels of Capex, despite the economic downturn, growing the business for the long term. Capex by Business Line B Invested over 110 billion 30 Upstream during the past five years Downstream 25 Chemical…
Dividends We provide reliable and growing dividends through the business cycle. Dividends per Share Dividend growth through the cycle 1.80 Per share increase of 57% over the last five years 1.35 Average growth 9.4% per year U.S.…
Share Purchases In 2009, we distributed 18 billion to shareholders through share purchases. Cumulative Purchases to Reduce Shares Outstanding 119 billion distributed over B the last five years 120 90 Reduced shares outstanding…
Increasing Ownership Strong business results and share purchases increase per share ownership for our shareholders. Growth per Share Since 2005* Percent Strong per share growth in XOM 40 BP key business metrics CVX 30 RDS 20 Ahead of…
Value per Share Earnings per share is enhanced by our share purchase program. Impact of Share Purchases on EPS Since ExxonMobil Merger 2009 EPS 3.98 per share Percent 50 EPS 44% higher than 40 without share purchases* 30 20…
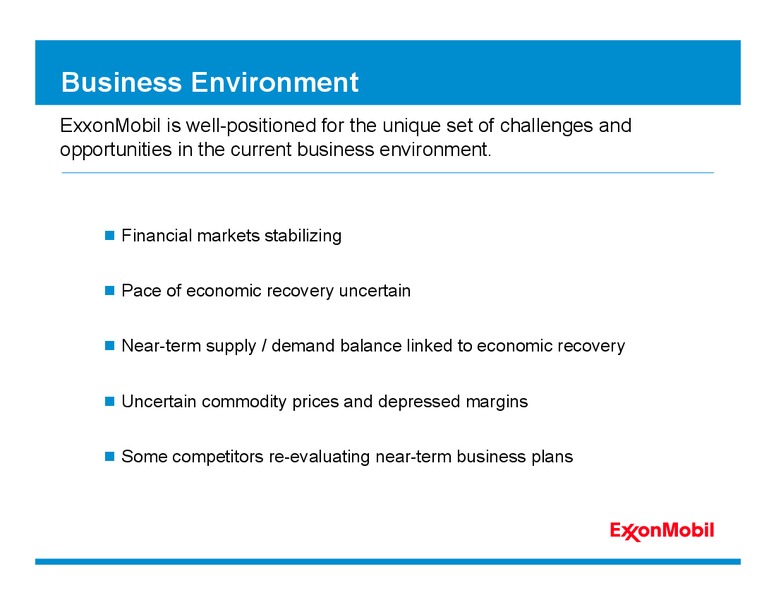
Business Environment ExxonMobil is well-positioned for the unique set of challenges and opportunities in the current business environment. Financial markets stabilizing Pace of economic recovery uncertain Near-term supply /…
Energy Demand to 2030 Global energy demand is expected to grow almost 35% by 2030 led by economic progress in developing nations even with large efficiency gains. Energy Demand Quadrillion BTUs Global energy mix will remain 300…
Investment Plan ExxonMobil is committed to investing through the business cycle. We expect to invest 25 to 30 billion per year through 2014. Capex by Business Line Upstream B Downstream Progressing large inventory of Estimate Range…
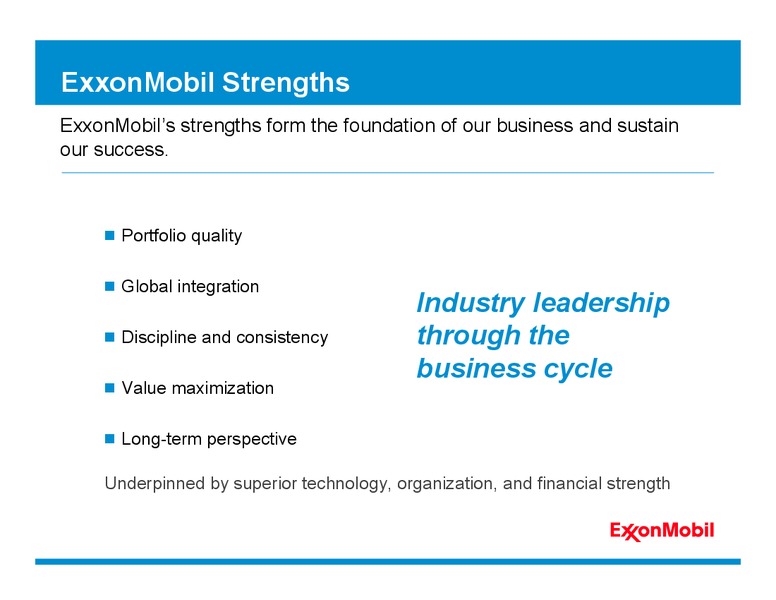
ExxonMobil Strengths ExxonMobils strengths form the foundation of our business and sustain our success. Portfolio quality Global integration Industry leadership Discipline and consistency through the business cycle Value…
Upstream Overview Mark Albers Senior Vice President Andy Swiger Senior Vice President
2009 Upstream Highlights We maintained our industry-leading earnings position, delivered superior returns, and added profitable volumes to our resource base. Earnings 17.1 B ROCE 23.4 % Production volumes 3.9 MOEBD Resource…
Upstream Strategies Consistent execution of our clearly defined strategies delivers superior results. Ensure operational integrity: best-in-class performance Identify and selectively pursue the highest-quality exploration…
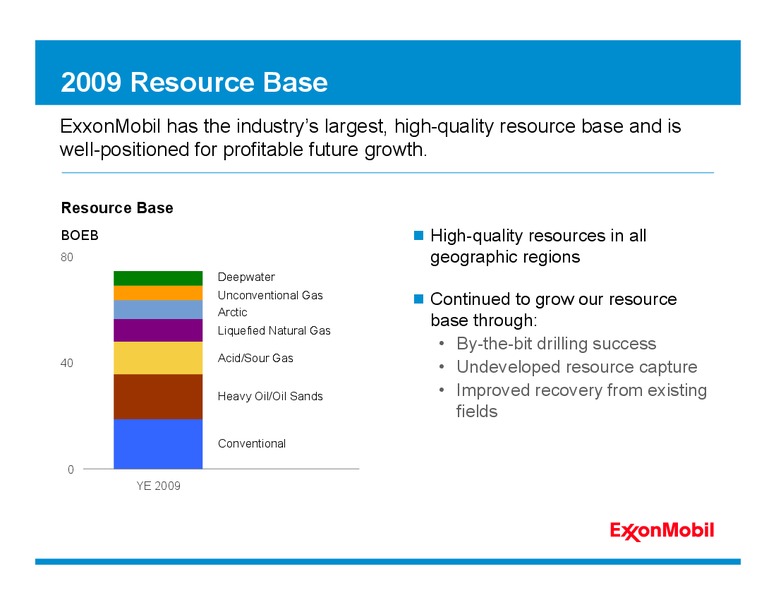
2009 Resource Base ExxonMobil has the industrys largest, high-quality resource base and is well-positioned for profitable future growth. Resource Base BOEB High-quality resources in all 80 geographic regions Deepwater Unconventional…
2009 Resource Base Increase We added 3.9 BOEB to our resource base from consistent by-the-bit success, undeveloped resource capture, and additional field recovery. Canada Horn River Canada U.K. Athabasca North Caspian Canada…
2009 Acreage Acquisition We acquired material acreage positions across the world in highly prospective plays. Norway Canada Horn River Canada Poland Athabasca Germany Hungary Turkey U.S. Marcellus U.S. Gulf of Mexico Vietnam…
Key Exploration Wells We are executing a major exploration program focused on high-potential opportunities. Canada Horn River Canada Orphan Poland Germany Turkey U.S. Eagle Ford U.S. Marcellus Libya U.S. Gulf of Mexico Vietnam…
U.S. Gulf of Mexico We have made significant discoveries at Hadrian and Julia and have a strong acreage position to provide future growth opportunities. New Orleans Houston 2.2 million net acres with exposure to Pliocene, Miocene,…
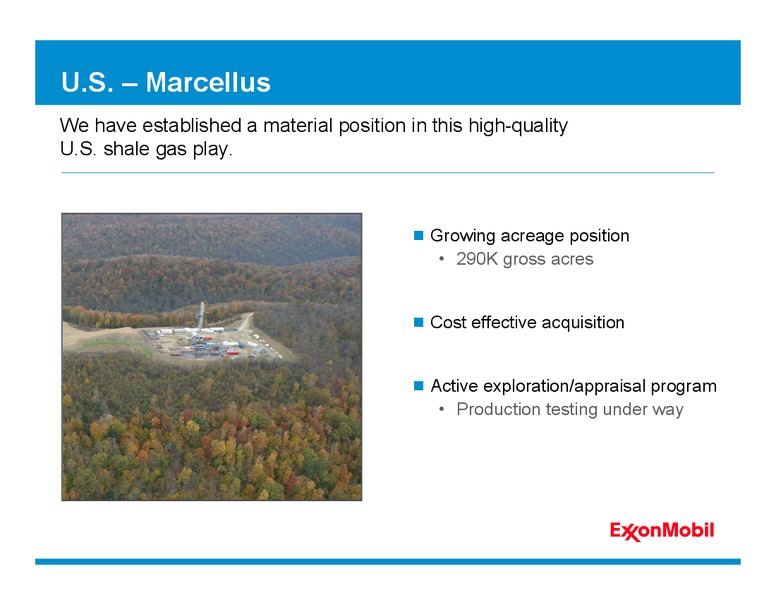
U.S. Marcellus We have established a material position in this high-quality U.S. shale gas play. Growing acreage position 290K gross acres Cost effective acquisition Active exploration/appraisal program Production testing…
Canada Horn River We achieved early entry and have established the leading acreage position in this emerging high-potential shale gas basin. Acquisition cost 40% less than industry average Ramping up drilling and seismic…
Canada Firebag Successful acquisition of additional oil sands acreage in a world-class resource area. 6 miles Firebag North Firebag North acquisition, extended existing strong position Potential synergies with Kearl Firebag…
Philippines Sulu Sea Successful exploration in frontier basin utilizing our extensive deepwater capabilities. Successful Dabakan-1 wildcat well Encountered hydrocarbons in multiple reservoir intervals Multiple prospects remaining…
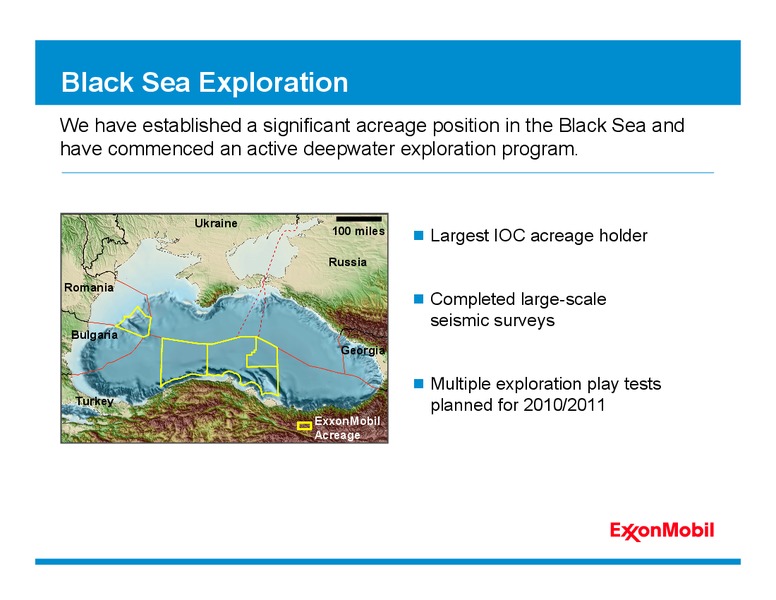
Black Sea Exploration We have established a significant acreage position in the Black Sea and have commenced an active deepwater exploration program. Ukraine 100 miles Largest IOC acreage holder Russia Romania Completed…
Major Project Inventory Our extensive portfolio of over 130 major projects allows selective investment decisions to deliver superior financial performance. Major Project Distribution by Region Percent, number of projects Develop 24 net…
2009 Project Start-ups Delivered eight major start-ups with forecast production of 400 KOEBD net in 2010. Qatargas 2 Qatargas 2 RasGas South Hook LNG Train 4 Train 5 Train 6 Terminal Adriatic LNG Al Khaleej Gas Piceance…
Near-Term Project Start-Ups Twelve major project start-ups planned between 2010 and 2012. LNG LNG Arctic Conventional RasGas Train 7 Golden Pass Terminal Sakhalin-1 Odoptu Nigeria Satellites Ph 1 Deepwater Deepwater…
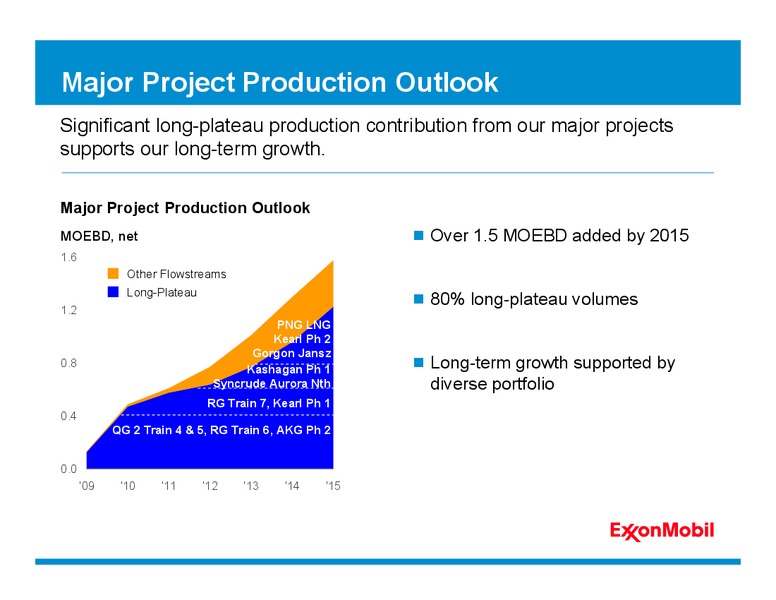
Major Project Production Outlook Significant long-plateau production contribution from our major projects supports our long-term growth. Major Project Production Outlook MOEBD, net Over 1.5 MOEBD added by 2015 1.6 Other Flowstreams…
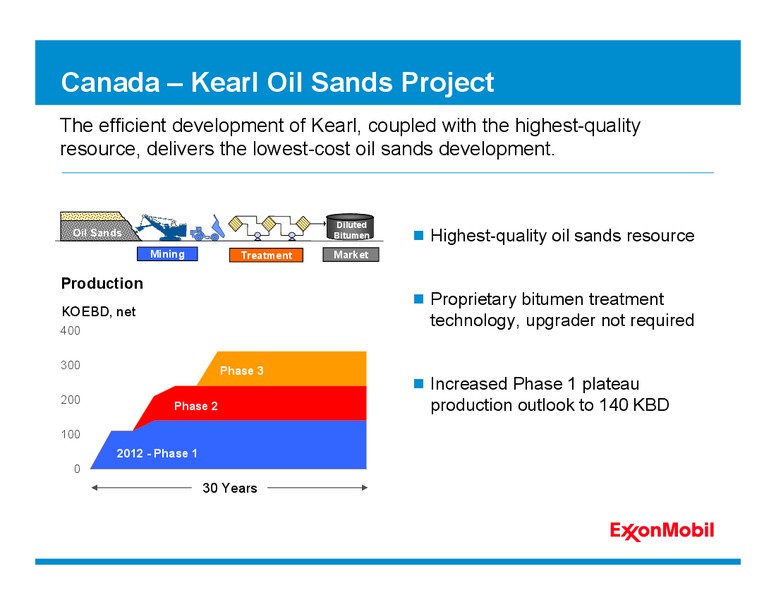
Canada Kearl Oil Sands Project The efficient development of Kearl, coupled with the highest-quality resource, delivers the lowest-cost oil sands development. Diluted Oil Sands Bitumen Highest-quality oil sands resource Mining…
Papua New Guinea PNG LNG Project We will develop the PNG LNG project utilizing our global LNG experience, and grow our presence in the attractive Asia Pacific gas market. High-quality 9 TCF gross resource Terrain Photo Two-train…
Indonesia Banyu Urip Project We are progressing full field development of this significant conventional oil project in Indonesia. Achieved early oil start-up in August 2009, 20 KBD capacity Full field development to deliver 165…
Upstream Research and Development Delivering advantaged technologies across our business and progressing significant breakthrough research. Exploration Development Production Imaging Drilling Flow Assurance Oil Shale Extraction…
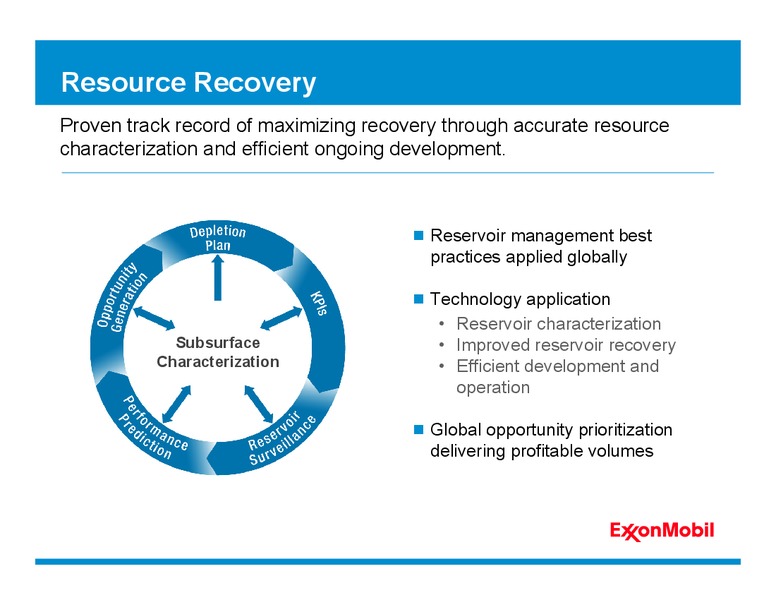
Resource Recovery Proven track record of maximizing recovery through accurate resource characterization and efficient ongoing development. Reservoir management best practices applied globally Technology application Reservoir…
Abu Dhabi Upper Zakum Applying high-impact technology and cost effective design to maximize recovery from one of the worlds largest oil fields. Pursuing innovative development approach Artificial islands Extended-reach drilling…
Iraq West Qurna-1 ExxonMobil is well-positioned to redevelop this field to achieve its maximum potential. Signed agreement in January 2010 Effective date March 1, 2010 Iraq Completed initial production tests West Qurna-1…
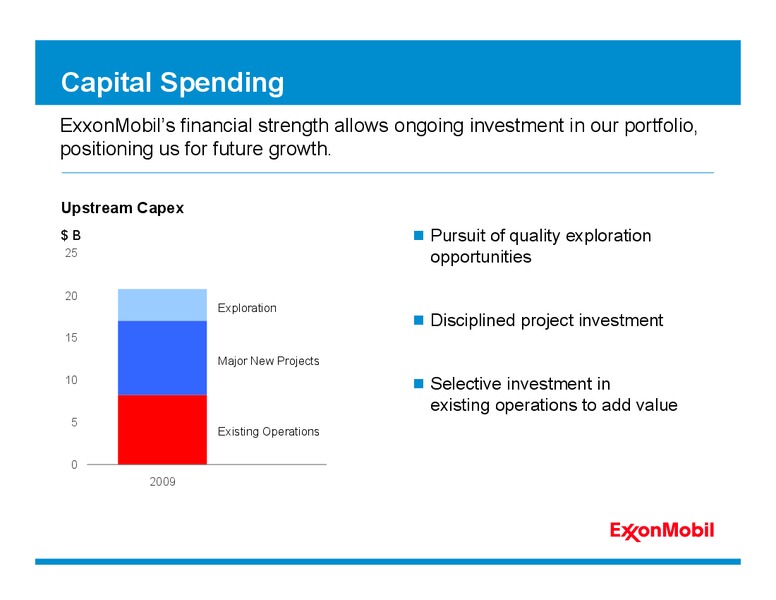
Capital Spending ExxonMobils financial strength allows ongoing investment in our portfolio, positioning us for future growth. Upstream Capex B Pursuit of quality exploration 25 opportunities 20 Exploration Disciplined project…
Operational Excellence Global best practice deployment delivers superior reliability and life cycle cost performance. Standardize Operate and Maintain Achieving superior reliability Operated uptime 2% higher than assets…
Production Outlook Production outlook delivered by strong base performance, high-quality projects, and new resource potential. Total Production Outlook MOEBD, net MOEBD, net 5 5 New Resource Additions New Resource Additions 4 4…
2009 Gas Marketing Activities We leveraged our global gas marketing footprint to commercialize our natural gas resources. Alaska Pipeline Project South Hook Terminal Piceance Ph 1 PetroChina, Adriatic LNG Tepco, Sinopec Terminal…
Gas Marketing Position Significant gas portfolio of quality operations and advantaged projects, spans all major markets, resource types, and contract structures. Projected Gas Sales Portfolio 2010 ExxonMobil-Interest 69 TCF proved gas…
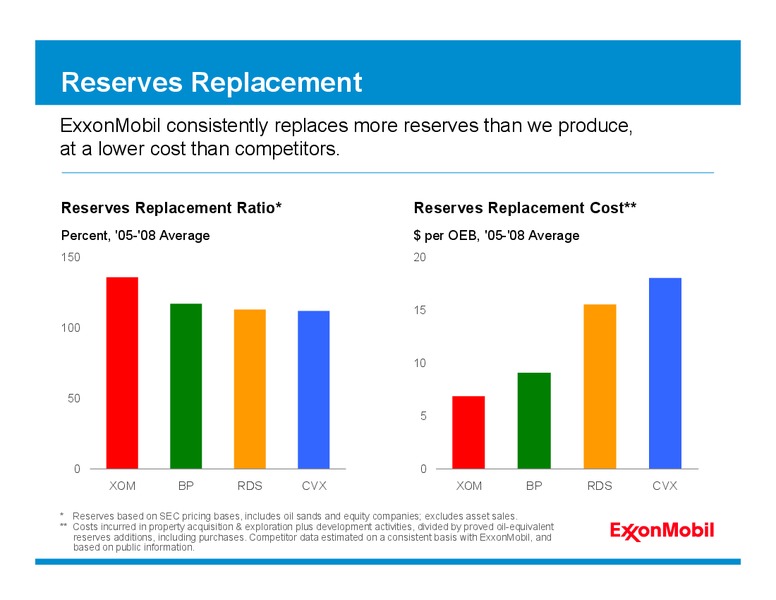
Reserves Replacement ExxonMobil consistently replaces more reserves than we produce, at a lower cost than competitors. Reserves Replacement Ratio* Reserves Replacement Cost** Percent, '05-'08 Average per OEB, '05-'08 Average 150 20…
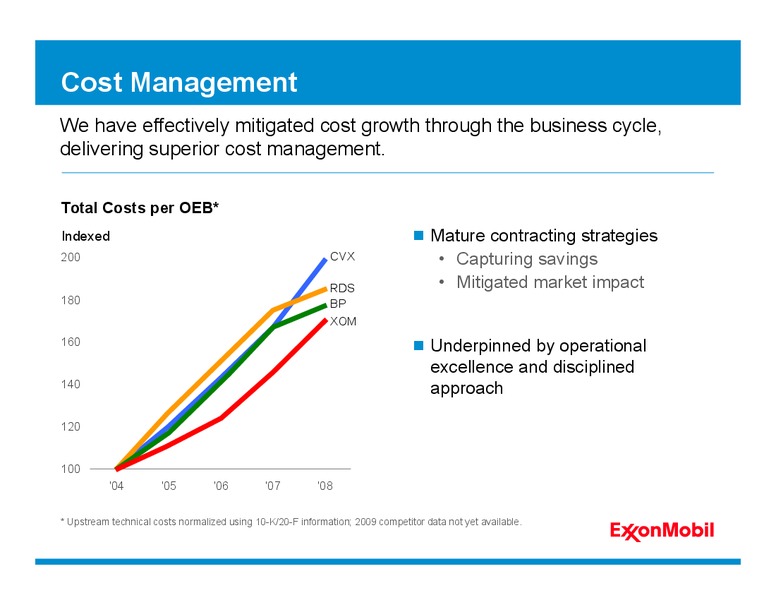
Cost Management We have effectively mitigated cost growth through the business cycle, delivering superior cost management. Total Costs per OEB* Indexed Mature contracting strategies 200 CVX Capturing savings RDS Mitigated market impact…
Growth per Share Delivered best production growth per share versus competition. Production per Share Indexed* Significantly enhanced share value 130 over 5-year period XOM 120 Annual average per share increase: CVX BP Production…
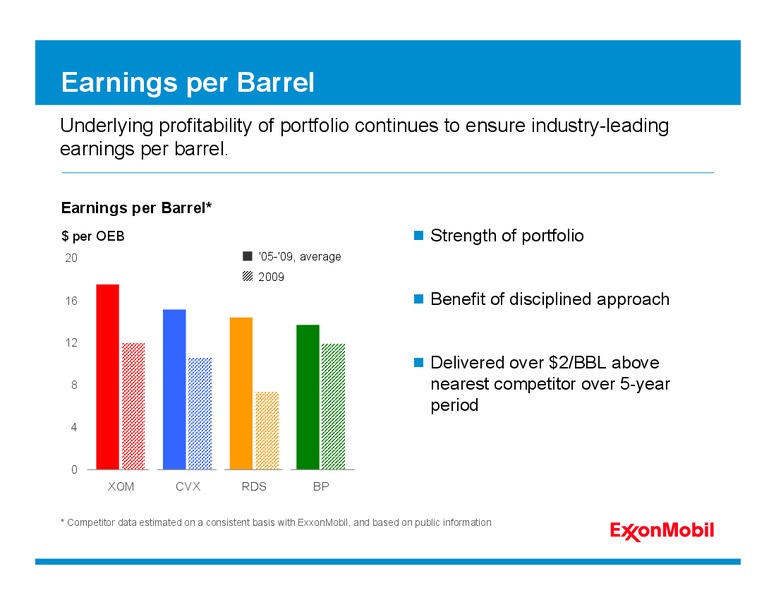
Earnings per Barrel Underlying profitability of portfolio continues to ensure industry-leading earnings per barrel. Earnings per Barrel* per OEB Strength of portfolio 20 '05-'09, average 2009 16 Benefit of disciplined approach 12…
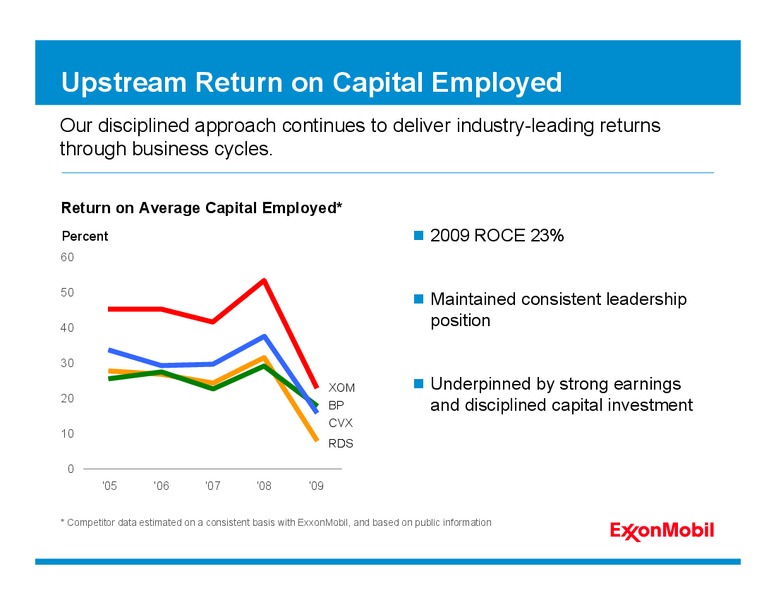
Upstream Return on Capital Employed Our disciplined approach continues to deliver industry-leading returns through business cycles. Return on Average Capital Employed* Percent 2009 ROCE 23% 60 50 Maintained consistent leadership 40…
LNG ExxonMobil is a significant LNG producer with a strong global position. Adriatic LNG Terminal, Italy
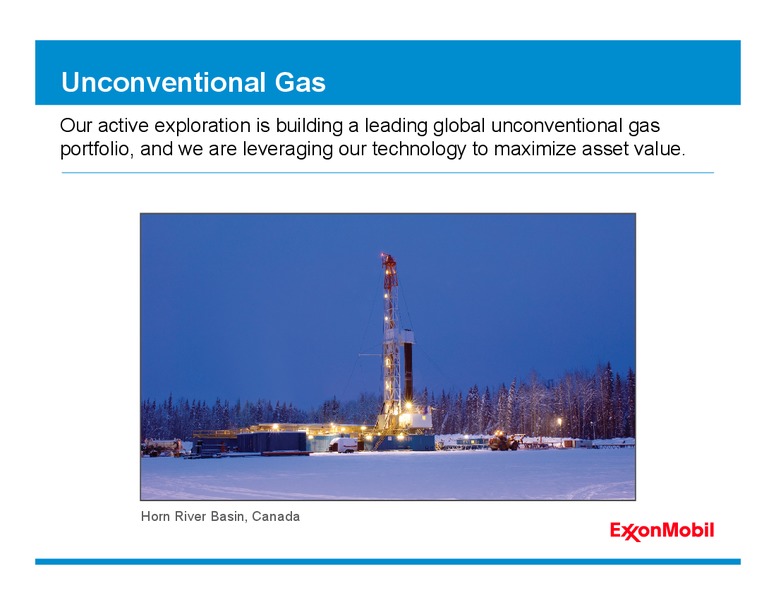
Unconventional Gas Our active exploration is building a leading global unconventional gas portfolio, and we are leveraging our technology to maximize asset value. Horn River Basin, Canada
Acid / Sour Gas Controlled Freeze ZoneTM technology has the potential to commercialize additional sour gas resources and assist meeting the global GHG challenge. Controlled Freeze ZoneTM Demonstration Plant, Wyoming, U.S.
Arctic We are well-placed to deliver our portfolio of projects, applying our experience and proprietary technology in this challenging environment. Sakhalin-1 Odoptu, Russia
Heavy Oil / Oil Sands We have extensive oil sands experience and a high-quality project portfolio. Karl Phase 1 Cold Lake, Alberta, Canada
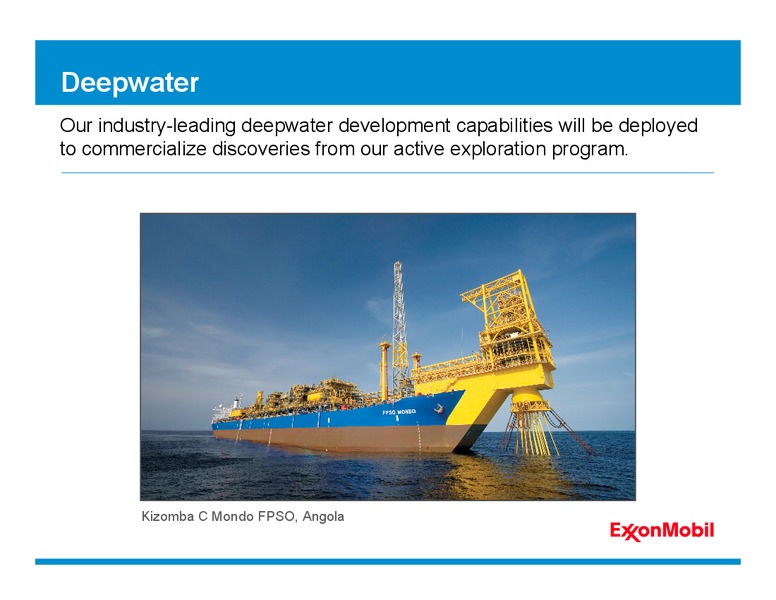
Deepwater Our industry-leading deepwater development capabilities will be deployed to commercialize discoveries from our active exploration program. Kizomba C Mondo FPSO, Angola
Conventional Our attractive conventional assets are developed efficiently to maximize value, with best practices leveraged globally. Jerneh B, Malaysia
Upstream Summary ExxonMobil is well-positioned to continue to deliver superior value to our shareholders. Largest, highest-quality opportunity portfolio Successfully growing the portfolio Lowest life-cycle cost, exploration to…
Downstream Overview Don Humphreys Senior Vice President Mike Dolan Senior Vice President
2009 Downstream Highlights ExxonMobil delivers industry-leading Downstream ROCE. Earnings 1.8 B ROCE 7 % Refinery Throughput 5.4 MBD Petroleum Product Sales 6.4 MBD Capex 3.2 B
Downstream Industry Environment Long-term demand is expected to increase, but the current business environment remains very challenging. Transportation Energy Demand MOEBD Long-term demand growth driven by 60 developing countries 50…
Downstream Strategies Consistent strategies drive our performance in both high- and low-margin periods. Maintain best-in-class operations, in all respects Provide quality, valued products and services to our customers Lead…
Downstream Strengths Our Downstream strengths provide long-term competitive advantage. Operational Excellence Technology Leadership Capital Discipline Integration Efficiency Global Functional Organization
Downstream Business Overview The ExxonMobil global Downstream portfolio is robust and includes unique integration synergies. Refining & Supply Fuels Marketing Lubricants & Specialties Global refiner Diverse portfolio Global…
Fuels Marketing Diverse sales channels provide secure, ratable, and profitable outlets for our refineries. Global Fuels Marketing Sales Access to broad spectrum of Industrial and customer channels Retail Wholesale 10% 37% 48% Global…
Operating Cost Efficiency Fuels Marketing ExxonMobils competitive cost advantage is captured by global solutions. Operating Expense Indexed Global resources drive lower 100 operating expenses Functional organization Systems 95…
Capital Productivity Fuels Marketing Asset optimization initiatives and productivity increases underpin improved results. Average Capital Employed Productivity (Sales/Avg. Capital Employed) Indexed Indexed 100 150 80 100 60 40…
Lubricants & Specialties Our Lubricants & Specialties business adds value by leveraging integration, technology, and brands. Basestock Manufacturing Product Technology Select Market Investments Integration advantages…
Brands and Technology Lubricants & Specialties Globally recognized brands and leading-edge technology deliver value to our customers. Synthetic Market Share Percent 15 Market leader in high-value synthetic lubes 10 Legacy of…
Growth Lubricants & Specialties Growing high-value opportunities faster than industry drives our strong performance. Synthetic Lubricants Sales Growth Developing Markets Sales Growth* Percent Change versus 2005 Percent Change versus 2005…
Refining & Supply ExxonMobil is the largest global refiner and has a scale advantage. Average Refinery Size KBD Refineries 60% larger than industry* 250 Most conversion capacity Largest lube basestock capacity 200 High-performing…
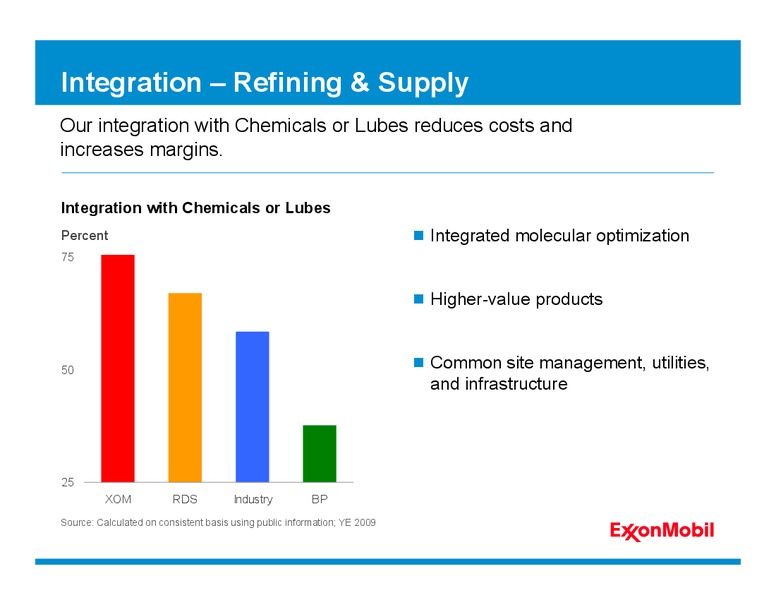
Integration Refining & Supply Our integration with Chemicals or Lubes reduces costs and increases margins. Integration with Chemicals or Lubes Percent Integrated molecular optimization 75 Higher-value products 50 Common site…
Feed Flexibility Refining & Supply ExxonMobil improves margins by processing raw materials sold at a discount in the market. Challenged Crudes* Throughput, Indexed Lower-cost feedstocks 160 improve margins 140 Technology advantages…
Operating Cost Efficiency Refining & Supply We continue to increase our cost advantage over the industry. Unit Cash Operating Expense Indexed Maintaining cost leadership 130 Global circuit average in top quartile Industry 120…
Energy Efficiency Refining & Supply Our energy efficiency initiatives improve our competitive advantage. Energy Intensity Indexed Cogeneration investments 110 Industry Global Energy Management System 105 Energy saving…
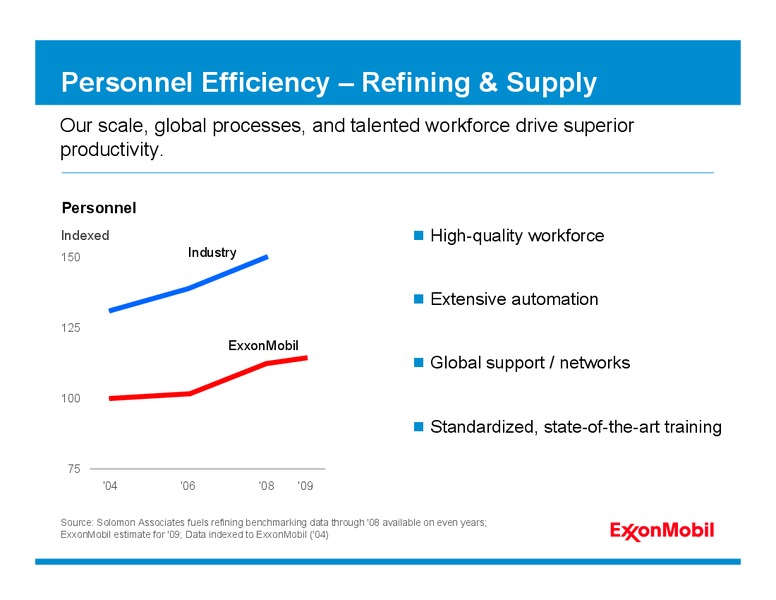
Personnel Efficiency Refining & Supply Our scale, global processes, and talented workforce drive superior productivity. Personnel Indexed High-quality workforce 150 Industry Extensive automation 125 ExxonMobil Global support /…
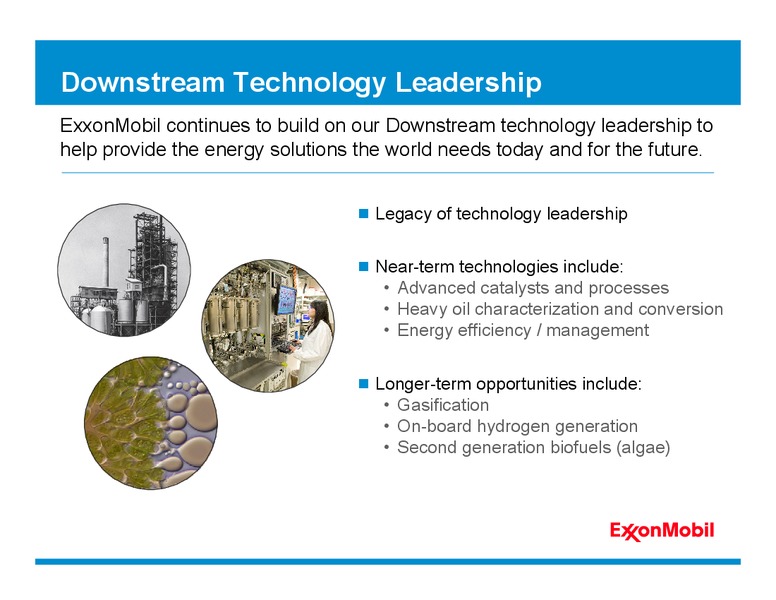
Downstream Technology Leadership ExxonMobil continues to build on our Downstream technology leadership to help provide the energy solutions the world needs today and for the future. Legacy of technology leadership Near-term…
Downstream Portfolio Management We actively manage our capital employed through all parts of the business cycle. Average Capital Employed B Disciplined capital management 30 Robust portfolio management processes 25 Significant…
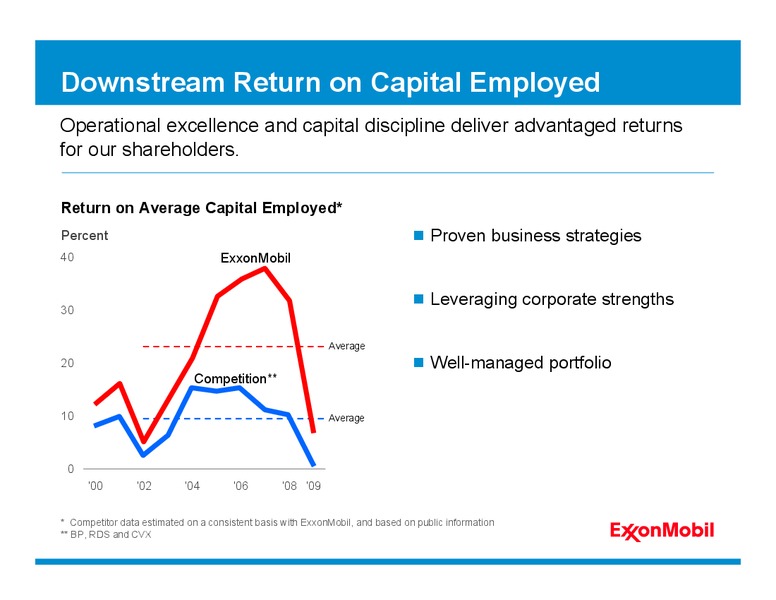
Downstream Return on Capital Employed Operational excellence and capital discipline deliver advantaged returns for our shareholders. Return on Average Capital Employed* Percent Proven business strategies 40 ExxonMobil Leveraging…
Chemical Overview Mike Dolan Senior Vice President
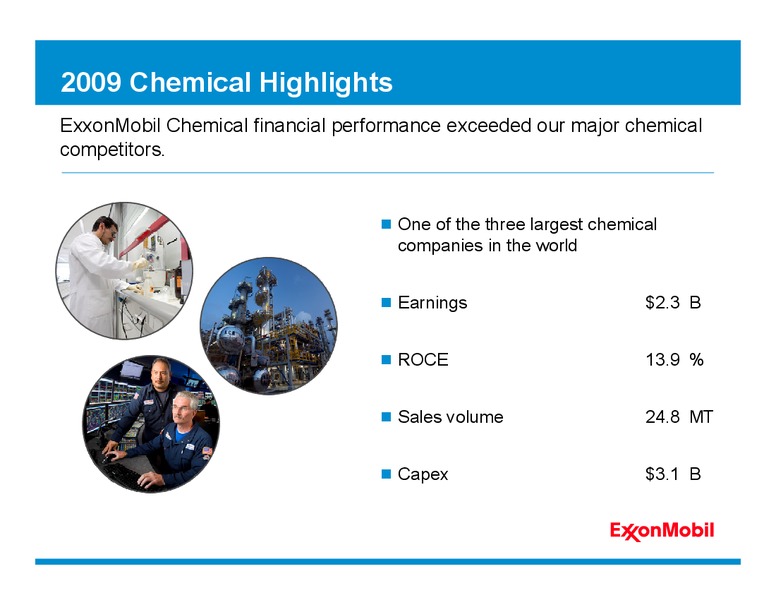
2009 Chemical Highlights ExxonMobil Chemical financial performance exceeded our major chemical competitors. One of the three largest chemical companies in the world Earnings 2.3 B ROCE 13.9 % Sales volume 24.8 MT Capex 3.1…
Global Demand Our products feed a wide range of growing markets and applications. Commodities Demand and Global GDP Year-on-Year Change Global demand growth above GDP Percent Chemical Commodity Demand* 12 Global GDP Driven by…
Chemical Industry Chemical industry capacity utilization and margins are cyclical. Key Chemical Commodity Trends* Nominal Margin Capacity Utilization Industry recovering from Indexed Percent weak demand 250 Capacity Utilization 95…
Chemical Strategies The consistent execution of our strategies over multiple business cycles is the foundation of our financial return leadership among our competitors. Unique portfolio of global businesses Integration across…
Business Portfolio Our portfolio captures the benefits of scale from commodities while maximizing the value of specialties. Earnings B Commodities capture upside Specialty 5 earnings potential at peak of cycle Commodity 4 Specialties…
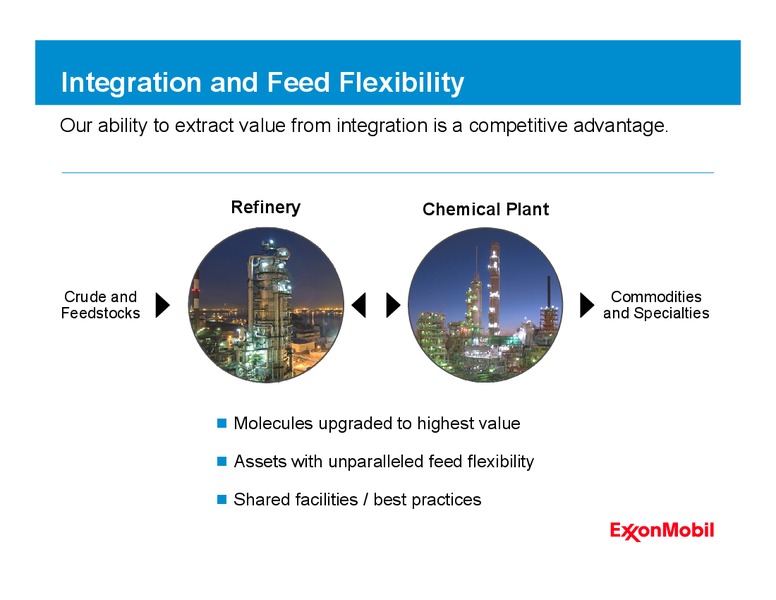
Integration and Feed Flexibility Our ability to extract value from integration is a competitive advantage. Refinery Chemical Plant Crude and Commodities Feedstocks and Specialties Molecules upgraded to highest value Assets…
Operational Excellence Our relentless focus on operational excellence in all aspects of our business creates a competitive advantage. Operating Costs* Energy Intensity* North America Steam Cracker Fixed Costs, Indexed Global Steam…
Asia Pacific Growth We have been a key supplier in Asia Pacific and are increasing our capacity to meet future demand growth. Asia Pacific / Middle East Capacity Ethylene & Paraxylene Asia Pacific 60% of future growth Million Metric…
Advantaged Growth Projects Our major investments maximize returns through a unique combination of advantaged feeds, lower-cost processes, and premium products. Advantaged Lower-Cost Premium Feeds Processes Products 9 Significant 9…
Chemical Technology Development and deployment of industry-leading chemical technology provide a competitive advantage. Advantaged feeds High level of feed flexibility Lower-cost manufacturing processes Advanced processes and…
Chemical Return on Capital Employed ExxonMobil Chemical has outperformed our major competitors across the last cycle. Return on Average Capital Employed* Percent Consistent strategy execution 40 ExxonMobil Major Competitors** Unique…
Summary ExxonMobil has unequaled performance across the Downstream and Chemical platforms. Return on Average Capital Employed* 2002 - 2009 Industry-leading integration Percent Downstream Chemical 25 Businesses optimized together 20 to…
Summary Rex Tillerson Chairman and CEO
Proven Business Model ExxonMobils business model delivers superior results and provides a unique, competitive advantage.
Risk Management We manage risk with well-developed processes and Board oversight. Financial Geopolitical Environmental Technology
Shareholder Value Financial results and stock market returns are best viewed over a longer time-frame, consistent with our investment horizon. Annualized Shareholder Returns Percent 14 ExxonMobil Competitor Average* 12 S&P 500 10…
 Loading...