Shale / Resource Development Underpins Growth Investment Highlights Two new organic growth projects totaling A Footprint in Multiple And a Leading Position Drive Targas 450 million Shale / Resource Plays at Mont Belvieu Long-Term…
Targas G&P Assets Well Positioned Advances in E&P technology deployed in multiple shale / resource plays across the U.S. Gathering and Processing Division has 20 plants and 12,500 miles of pipe Permian Basin: Spraberry,…
Producer Activity Drives NGL Flows to Mont Belvieu Mont Belvieu is the premier NGL market hub because it interconnects with the Gulf Coast petrochemical complex Increased NGL supplies flow to Mont Belvieu Currently, most NGL…
Major Capital Projects Two new major projects announced in Q4 2012 Over 1.6 billion in announced projects expected to be completed in 2012 through 2014 Additional high quality growth projects under development for 2014 and beyond…
Margin is Largely Fee-Based / Hedged Fee-Based Margin is Increasing on Both an Absolute and Proportional Basis ( millions) 90.00 100% Capex projects with firm contracts provide clear visibility on increasing fee 80.00 73…
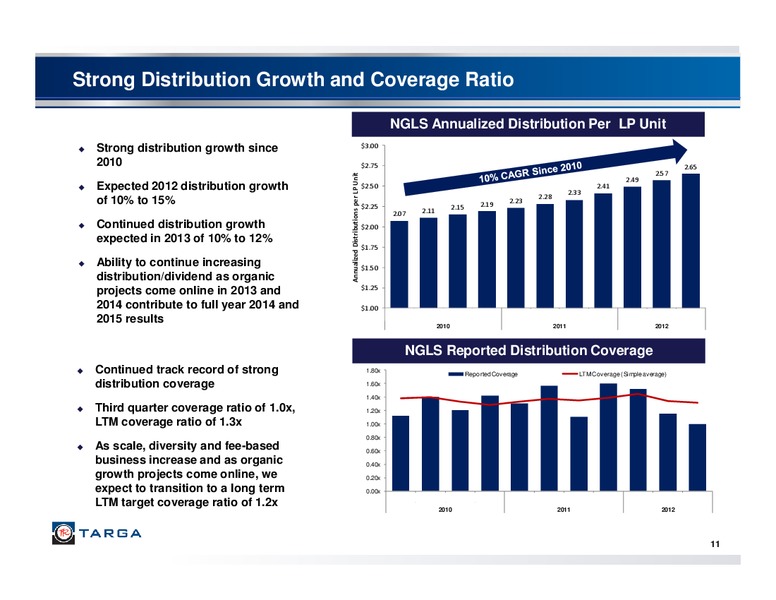
Strong Distribution Growth and Coverage Ratio NGLS Annualized Distribution Per LP Unit Strong distribution growth since 3.00 2010 2.75 2.65 2.57 Annualized Distributions per LP Unit 2.49 Expected 2012 distribution growth…
Solid Financial Profile Positions the Partnership for Growth Maintained relatively conservative capital NGLS Leverage Ratio and Unit Price Since IPO structure to underpin access to capital 6.0x 45 Target leverage ratio 3.0x - 4.0x…
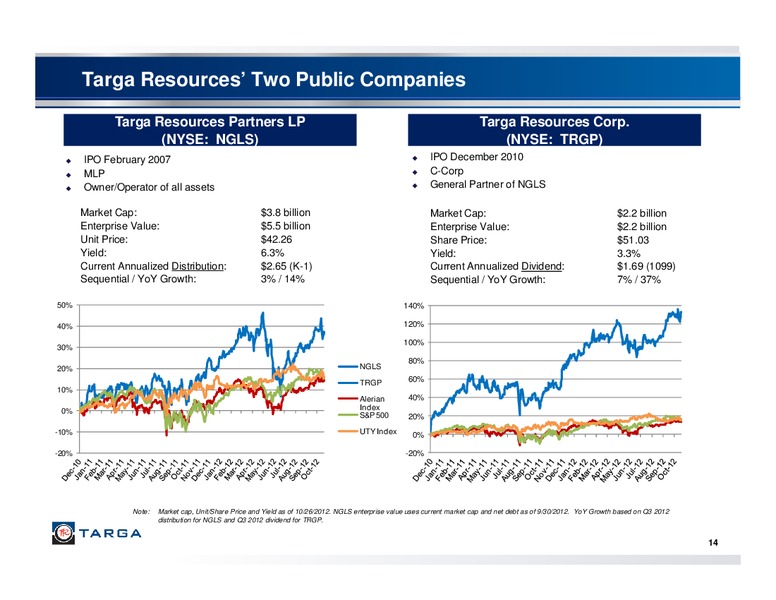
Targa Resources Two Public Companies Targa Resources Partners LP Targa Resources Corp. (NYSE: NGLS) (NYSE: TRGP) IPO February 2007 IPO December 2010 MLP C-Corp Owner/Operator of all assets General Partner of NGLS Market Cap: 3.8…
Business Division and Segment Review 15
Targas Integrated Midstream Platform LTM as of 9/30/2012 Segment Operating Margin Marketing and Distribution 15% Field G&P 39% Logistics Assets 21% Coastal G&P 25% 16
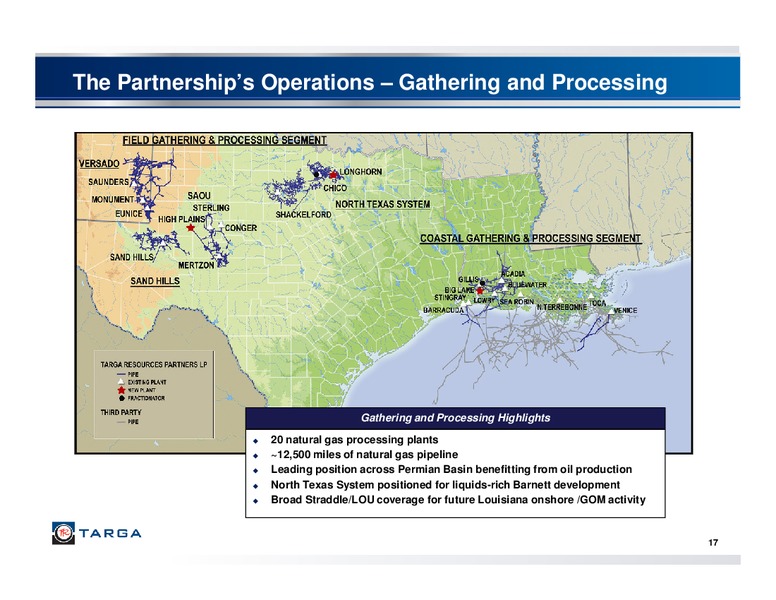
The Partnerships Operations Gathering and Processing Gathering and Processing Highlights 20 natural gas processing plants 12,500 miles of natural gas pipeline Leading position across Permian Basin benefitting from oil production…
Field Gathering and Processing Segment Field G&P Highlights Currently 9 plants with 847 MMcf/d of gross processing capacity Field G&P segment equity volumes are well hedged Permian Basin activity dominated by shale/resource plays;…
Targas Permian Basin Systems and Broad Active Plays SAOU All oil wells with associated gas and NGLs Record number of well connects in 2011 with Versado 383 30 MMcf/d processing capacity expansion expected to come on line by Q1…
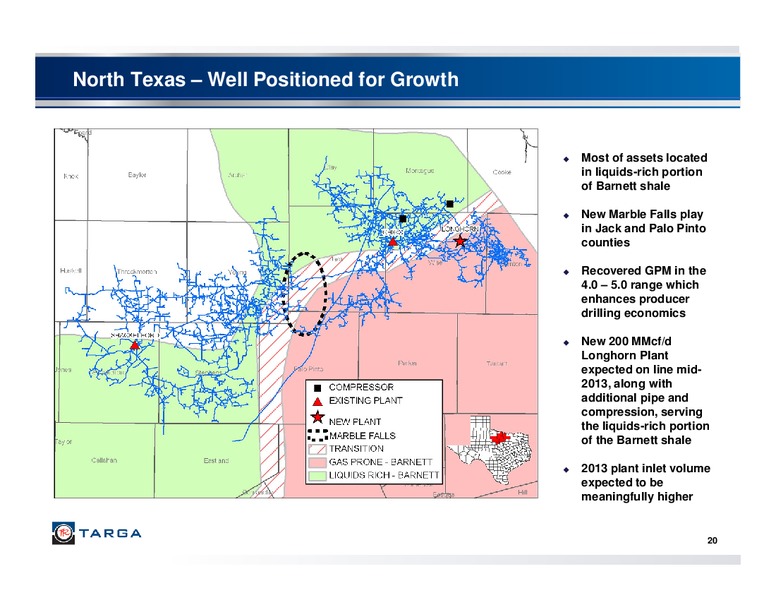
North Texas Well Positioned for Growth Most of assets located in liquids-rich portion of Barnett shale New Marble Falls play in Jack and Palo Pinto counties Recovered GPM in the 4.0 5.0 range which enhances producer drilling…
Logistics and Marketing Division Logistics Assets Highlights The Partnership is the second largest operator of fractionation capacity in Mont Belvieu and Louisiana combined CBF, GCF and Mont Belvieu terminaling and fractionation…
Logistics Assets Continued Growth Strategy Discussion Pipeline Capacity vs Fractionation Capacity Current pipeline constraints into Mont Belvieu is 2,500 removed when pipelines come online in the next 6-8 months 2,000 Significant…
Logistics Assets - Performance Trends Logistics Assets Performance Trends Logistics Assets Highlights 400 Second largest owner and operator of fractionation CBF Y-Grade Volumes MBbl/d capacity in Mont Belvieu and Louisiana 350 CBF…
Environment Favors U.S. Propane / Butane Export Growth U.S. Propane U.S. Gulf Coast propane and butane are 60 0.70 favorably priced compared to world 0.60 50 markets 0.50 40 0.40 Gulf Coast import/export expansions MMBbls…
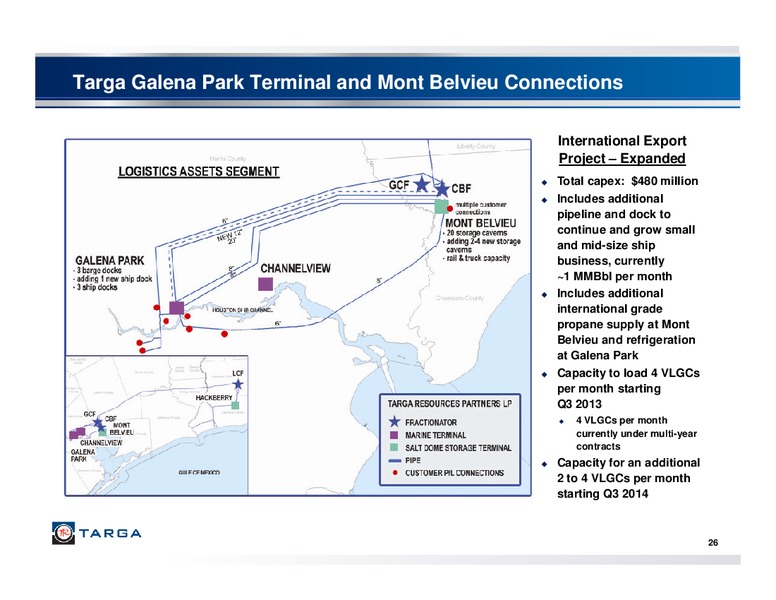
Targa Galena Park Terminal and Mont Belvieu Connections International Export Project Expanded Total capex: 480 million Includes additional pipeline and dock to continue and grow small and mid-size ship business, currently 1…
Petroleum Logistics - Current Capabilities and Projects 156 million in acquisitions in 2011 Announced 105 million of growth capital related to three terminals acquired in 2011 Pursuing additional acquisitions with similar…
Marketing and Distribution Segment Marketing and Distribution Highlights NGL and Natural Gas Marketing Manage physical distribution of mixed NGLs and specification products using owned and third party facilities Manage inventories…
Investment Highlights Strong industry fundamentals High quality assets Well positioned in U.S. shale / resource plays Leadership position at Mont Belvieu Superior connectivity to markets Increasing scale and diversity…
Appendix 30
Pro Forma Credit Metrics and Liquidity ( in millions) Pricing / Actual Oct 2012 Pro Forma (1) Cash and Debt Maturity Coupon 9/30/12 Adjustments 9/30/12 Cash and cash equivalents 89.5 89.5 Senior Secured Debt Jul-17 L + 175 bps 280.0…
SAOU Overview Highlights SAOU System Well Connects 400 1,670 miles of gathering pipelines and three processing plants with gross capacity of 139 MMcf/d, Conger 350 restarted in May 2011 300 33 compressor stations, 58 compressors and…
Sand Hills Overview Highlights Sand Hills Well Permits(1) Ector, Midland, Upton, Loving, Reeves and Ward 2500 1,400 miles of pipeline and one processing plant with gross capacity of 150 MMcf/d 2000 Recovered GPM in the 4.5 8.0…
North Texas Growth Update Highlights North Texas Well Permits (1) Montague, Cooke, Clay and Wise 1000 4,200 miles of gathering pipeline reaching 13 counties; two processing plants with capacity of 278 800 Well Permits MMcf/d;…
Non-GAAP Measures Reconciliation EBITDA and Gross Margin The following table presents a reconciliation of Adjusted EBITDA and operating margin to net income (loss) for the periods shown for TRP: Three Months Ended Nine Months Ended…
Non-GAAP Measures Reconciliation - DCF Millions The following table presents a reconciliation of reported distributable cash flow to net income (loss) for the periods shown for TRP: Three Months Ended 31-Mar 30-Jun 30-Sep 31-Dec…
Non-GAAP Measures Reconciliation Fee Based Margin The following table presents a reconciliation of operating margin to net income (loss) for the periods shown for TRP: Three Months Ended 3/31/2010 6/30/2010 9/30/2010 12/31/2010…
 Loading...