2012 Annual Meeting Financial and Operating Results
2011 Results Strong results across all key financial and non-financial parameters Strong industry safety performance Rigorous environmental management Superior financial / operating results Earnings 41B Volume growth 1% ROCE 24%…
Safety Safety performance remains strong in industry Lost Time Incident Rate Incidents per 200K hours Our vision: Nobody Gets Hurt 0.4 Employee Contractor Focus on operational excellence 0.3 U.S. petroleum industry and risk…
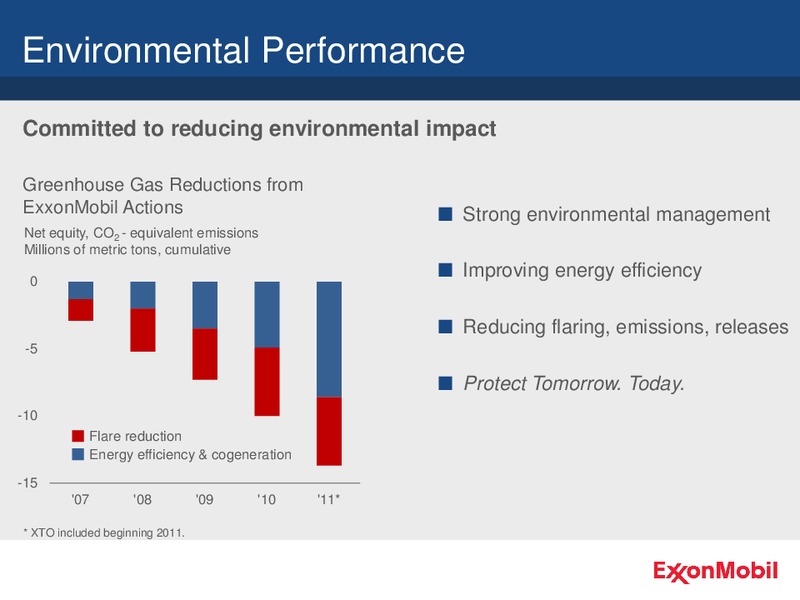
Environmental Performance Committed to reducing environmental impact Greenhouse Gas Reductions from ExxonMobil Actions Strong environmental management Net equity, CO2 - equivalent emissions Millions of metric tons, cumulative 0…
Earnings Earnings of 41B in 2011, an increase of 35 percent over 2010 Earnings Excluding Special Items B Strong performance across all 50 Upstream business lines Downstream Chemical 40 Total Earnings Leveraging integration…
Upstream Volumes Growth Project ramp-ups and strong unconventional performance drive growth 2011 Volume Growth Percent Largest non-government-owned 2 producer of oil and gas at 4.5 MOEBD 0 XOM 1 percent growth from 2010 RDS CVX…
Return on Capital Employed ROCE leadership supported by consistent business model Return on Average Capital Employed* Percent ROCE of 24 percent in 2011 30 Investments position long-term 2011 25 07 11, average performance 20 15…
Capex Maintained focus on selective investments to deliver superior returns Capex by Business Line B Invested 37B in 2011; a total of 40 Upstream 143B during the past five years Downstream Executed strategic acquisitions Chemical /…
Free Cash Flow Generation Cash generation unmatched among peers Total Free Cash Flow (07 11)* B Total free cash flow generation of 150 146B since beginning of 2007 Higher than competitors combined 125 100 Strong cash generation…
Dividends Reliable and growing dividends; 9 billion distributed in 2011 Dividend Growth since 1983* per share More than 40B distributed to shareholders over past five years 2.50 XOM 2.00 S&P 500 Dividend has grown every year CPI**…
Share Reductions Share purchases efficiently return cash to shareholders Shares Outstanding Millions of Shares 20B in share purchases in 2011 7,000 6,000 Over 30 percent reduction in shares outstanding since Exxon and Mobil 5,000…
Increasing Ownership Enhanced per share interest in ExxonMobil reserves and production Reserves Growth per Share since 2007* ** Production Growth per Share since 2007* Indexed; 2007 = 100 Indexed; 2007 = 100 Indexed Growth Indexed…
2012 Annual Meeting Energy Outlook
Energy Demand to 2040 Global energy demand likely to grow approximately 30% by 2040 Energy Demand Quadrillion BTUs Pace of demand growth moderated 300 2010 by efficiency gains across the world 2040 Annual Growth Rate to 2040 0.7%…
Liquids and Gas Supplies Expand and Diversify Technology continues to expand economic supplies Liquids Natural Gas MOEBD GCFD 120 700 Biofuels 100 600 Unconventional Natural Gas Liquids 500 80 Deepwater Unconventional 400 60…
The Energy Challenge Meeting the worlds growing energy needs safely and responsibly Requires broad-based economic solutions and diversity of supply Calls for unprecedented levels of investment Requires sound, stable government…
2012 Annual Meeting Competitive Advantages
Meeting the Worlds Energy Challenges Meeting the worlds ExxonMobils energy challenges requires: competitive advantages: Broad-based economic solutions and diversity of supply Balanced Portfolio Unprecedented levels Disciplined…
Competitive Advantage: Balanced Portfolio Diverse portfolio across resource types of growing importance in meeting global energy demand 2011 ExxonMobil Resource Base by Type by Geography Unconventional Conventional* Asia Americas…
Conventional 41% of Resource Base Delivering significant value from conventional resources Beaufort Sea Norway Alaska Kara Sea Canada Europe Kazakhstan Hebron/ Sakhalin Hibernia USA Azerbaijan Iraq Gulf of Mexico United Arab…
Unconventional 22% of Resource Base Growing global portfolio with early-mover, quality acreage pursuits Canada Europe USA China Play Type Indonesia Shale Gas Tight Gas Coal Bed Methane Argentina Tight / Shale Oil
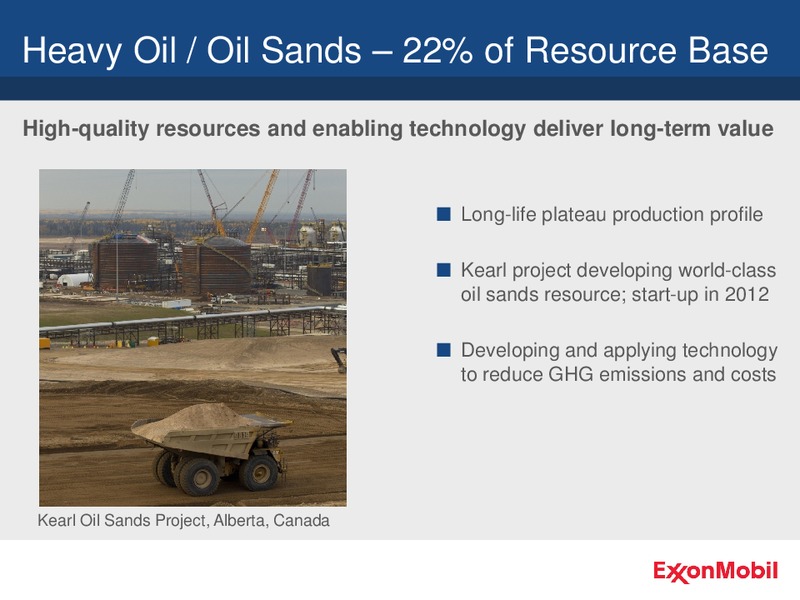
Heavy Oil / Oil Sands 22% of Resource Base High-quality resources and enabling technology deliver long-term value Long-life plateau production profile Kearl project developing world-class oil sands resource; start-up in 2012…
Liquefied Natural Gas 9% of Resource Base ExxonMobil has leading global liquefied natural gas capability Expanding global LNG markets South Hook Fluxys Golden Pass Adriatic Shimizu Advantaged projects progressing in Ras Laffan…
Deepwater 6% of Resource Base Building on established deepwater capability Faroe Islands Norway Innovative design approaches Ireland Superior project execution Black Sea Gulf of Mexico Cost-effective subsea satellite field…
Downstream Scale Advantage Largest global refiner with the highest level of integration Average Refinery Size* KBD Reneries 60 percent larger than 220 industry average Over 75 percent of our refining 200 180 capacity is integrated…
Chemical Portfolio Maximizes Value Industry-leading chemical performance driven by strong portfolio Earnings B Facilities strategically located, 5 Commodities Specialties supplying all major growth regions Commodities provide scale…
Industry-Leading Results Downstream and Chemical businesses outperform competition Downstream and Chemical Combined ROCE Percent Proven business strategies 40 enabled by technology ExxonMobil Competitor Range 30 Businesses…
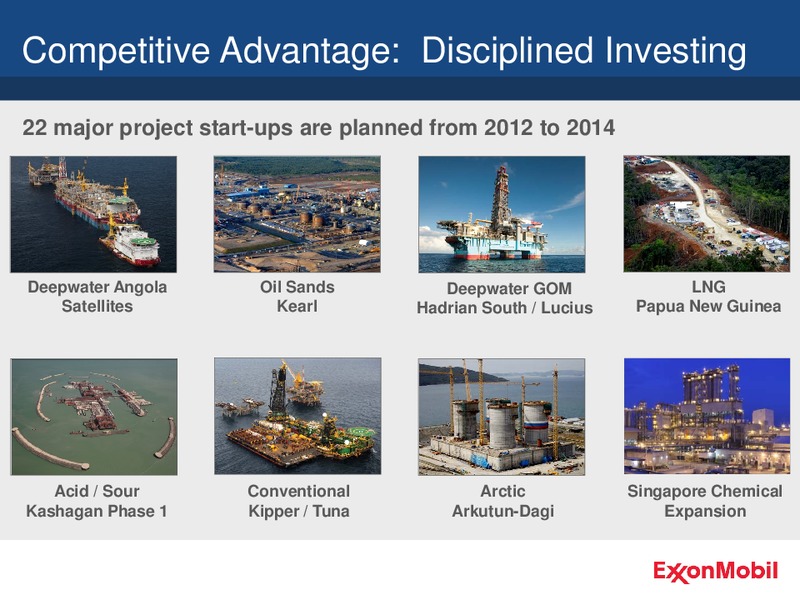
Competitive Advantage: Disciplined Investing 22 major project start-ups are planned from 2012 to 2014 Deepwater Angola Oil Sands Deepwater GOM LNG Satellites Kearl Hadrian South / Lucius Papua New Guinea Acid / Sour…
Competitive Advantage: Operational Excellence Risk management is fundamental to our business Common global expectations Well-developed and clearly-defined policies and procedures Management accountability High standards of design…
Competitive Advantage: Global Integration Continuing to create value through the integrated business model Maximize profitability of Upstream resources at each step of the value chain Competitive advantage of global functional…
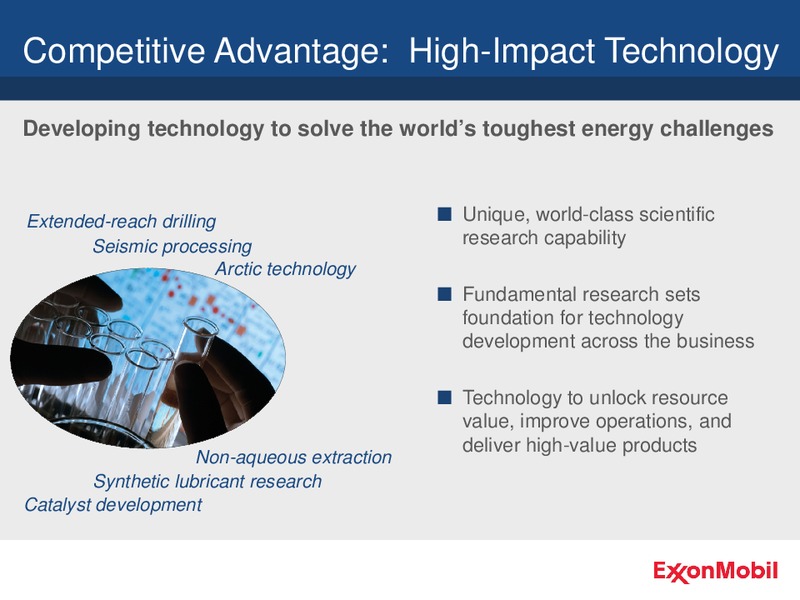
Competitive Advantage: High-Impact Technology Developing technology to solve the worlds toughest energy challenges Extended-reach drilling Unique, world-class scientific Seismic processing research capability Arctic technology…
Technology Leadership A commitment to technology and innovation Nearly 5 billion spent on research and development in last five years Attract and retain highest quality workforce Active engagement in developing the workforce of…
2012 Annual Meeting Summary
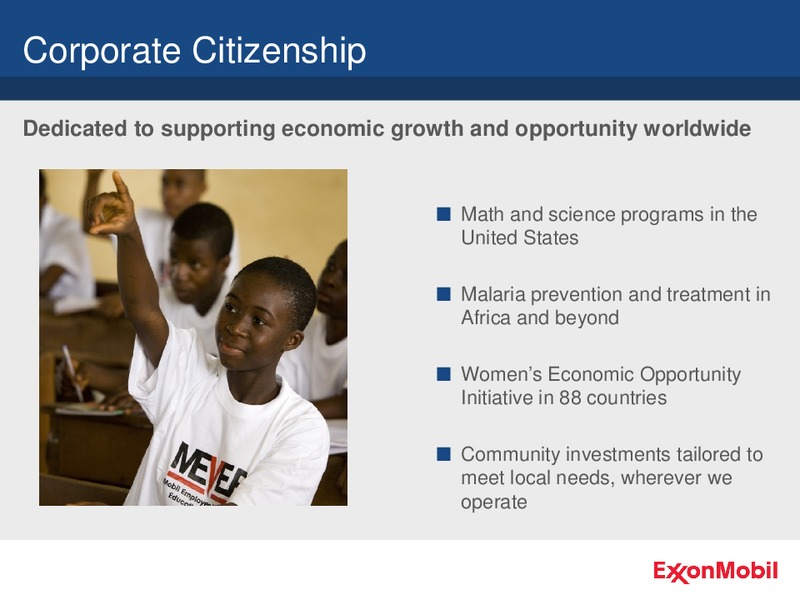
Corporate Citizenship Dedicated to supporting economic growth and opportunity worldwide Math and science programs in the United States Malaria prevention and treatment in Africa and beyond Womens Economic Opportunity Initiative…
Share Performance Long-term performance exceeds competitor average and S&P 500 Shareholder Returns Value of 1,000 Invested (as of YE 2011) K Financial results and stock market returns best viewed over long term 12 ExxonMobil 9…
ExxonMobil Strengths Relentless focus on maximizing long-term shareholder value Strong Financial and Operating Performance Balanced Portfolio Disciplined Investing Operational Excellence Global Integration High-Impact…
 Loading...