2Q 2003 results Significant improvement in efficiency August 2003
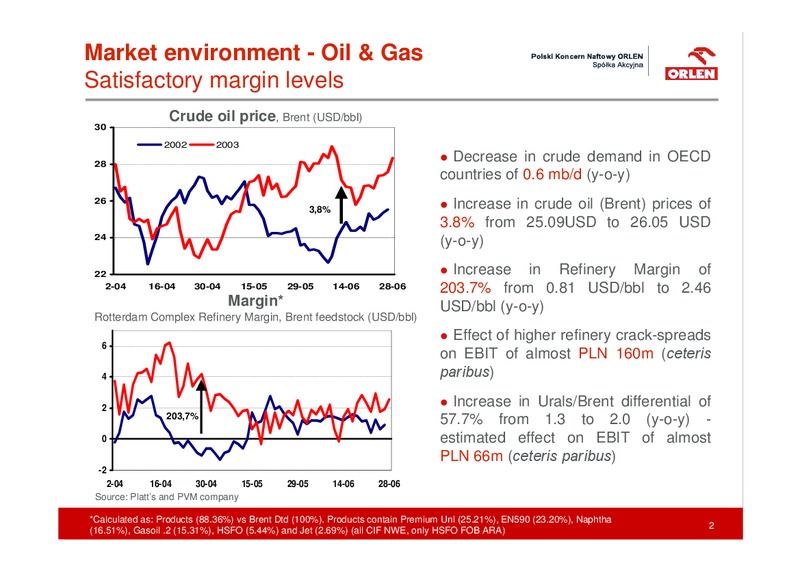
Market environment - Oil & Gas Satisfactory margin levels Crude oil price, Brent (USD/bbl) 30 2002 2003 28 l Decrease in crude demand in OECD countries of 0.6 mb/d (y-o-y) 26 3,8% l Increase in crude oil (Brent) prices of 3.8%…
Market environment Poland Economic recovery on track Real GDP growth 3.2E% l GDP growth shows big improvement 4% Estimates for FY03: 3.0- 3.5% confirming recovery of the economy. 3% However, it is not fully reflected in…
Financial highlights significant improvements in efficiency y-o-y as well as q-o-q IFRS basis, million PLN 2Q 03 2Q 02 change Revenue 5 933 3 932 50,9% l Surge in revenues due to EBIT 175 206 -15,0% consolidation of German…
Operating highlights wholesale market share in fuels re-gained l Increase in consolidated retail IFRS basis, million PLN 2Q 03 2Q 02 change sales due to consolidation of Retail sales of 969 545 77,8% German retail network motor…
Profit / Cash flow operating activities supported by disposal of non-core assets l German activities supported IFRS basis, million PLN 2Q 03 2Q 02 change revenues by almost PLN 1.8bn Revenue 5 933 3 932 50,9% * Cost of sales -4 931 -3…
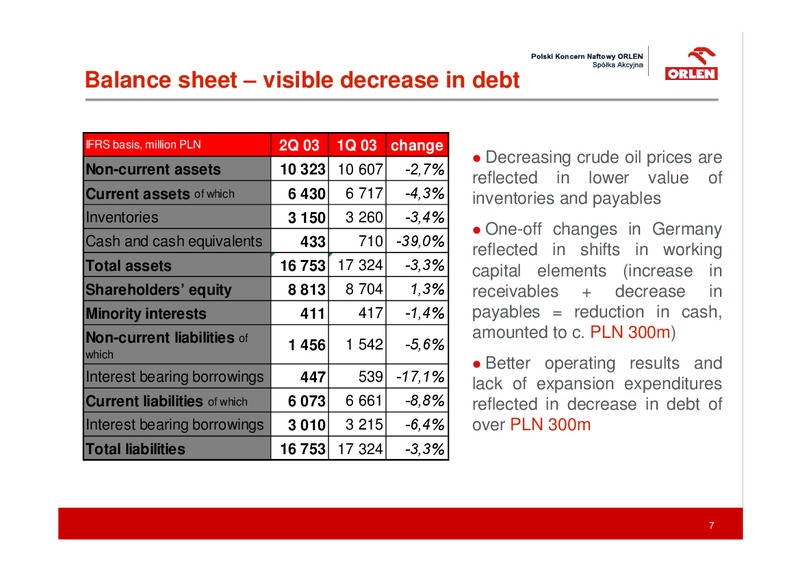
Balance sheet visible decrease in debt IFRS basis, million PLN 2Q 03 1Q 03 change l Decreasing crude oil prices are Non-current assets 10 323 10 607 -2,7% reflected in lower value of Current assets of which 6 430 6 717 -4,3%…
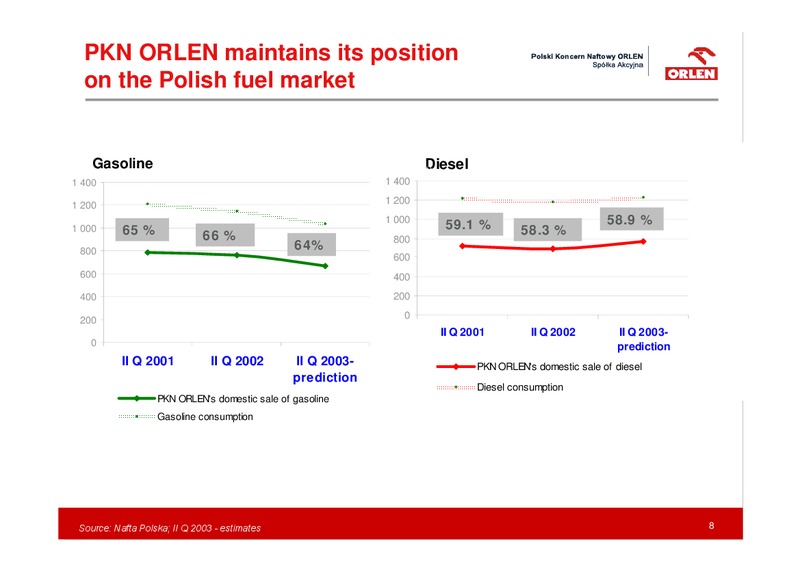
PKN ORLEN maintains its position on the Polish fuel market Gasoline Diesel (tt) (tt) 1 400 1 400 1 200 1 200 1 000 59.1 % 58.9 % 1 000 65 % 66 % 58.3 % 800 800 64% 600 600 400 400 200 200 0 II Q 2001 II Q 2002 II Q…
Visible increase in efficiency supported by gain in market share after 1Q03 disruption Refining and wholesales lSignificant shift between IFRS basis, mPLN 2Q03 2Q02 change Gasoline and Diesel sales Revenue 3 457 3 363 2,8% l Stable…
Optimisation of sales through CODO sites and authorised representatives of LHO Fuel sales structure 100% 21 19 19 18 l Increased share of company- 34 80% 38 owned stations in the structure of 23 21 domestic clients in order to 60%…
Optimisation of the margin reflected in better financial results Retail l First signs of recovery visible in IFRS basis, mPLN 2Q03 2Q02 change domestic volumes* - 2.5% increase, Revenue 2 984 985 202,9% y-o-y Total costs l Next…
Next consecutive quarter of robust profitability of Pet-chems Petrochemicals IFRS basis, mPLN 2Q03 2Q02 change l Increase in monomers as well Revenue 1 039 921 12,8% as fertilisers (prolonged Total costs agricultural works) volume…
Outlook for 2H03 Retail few percent increase in volumes with a slight decrease in unit margins on fuels, q-o-q (however big improvement y-o-y), but still visible increase in margin of non-fuel products. Volumes in Gasoline c. 4% down…
Supplementary slides 14
Purchase of the Germans sites proves to be an effective business Strict cost management and higher margins (7% up, q-o-q) result in good performance of German activities, which recorded over PLN 11m of net profit The trend was…
2Q2003 - influence of ORLEN Deutschland and JV with Basell on consolidated Balance Sheet and P&L 2Q2003 of which Germany Balance sheet - selected items (PLNm) 2Q2003 1Q2003 and Basell (*) Property, plant and equipment 9 449 597 9…
 Loading...