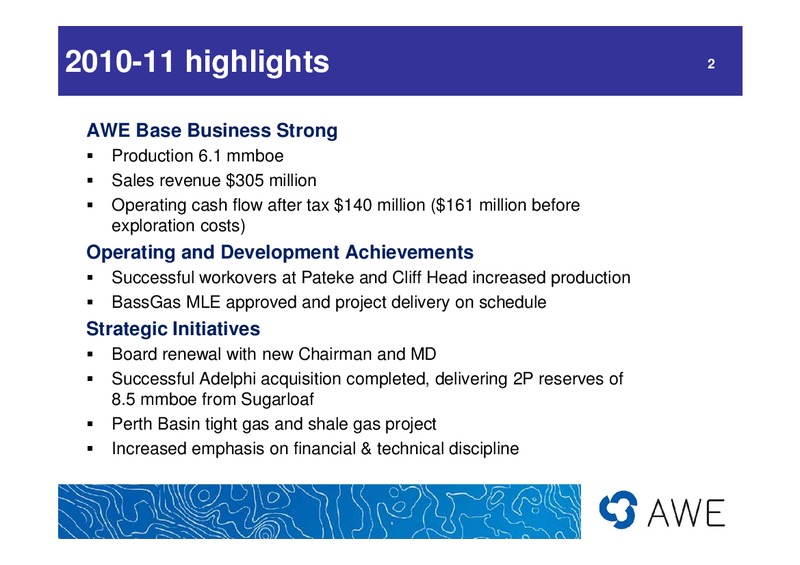
2010-11 highlights 2 AWE Base Business Strong Production 6.1 mmboe Sales revenue 305 million Operating cash flow after tax 140 million (161 million before exploration costs) Operating and Development Achievements Successful…
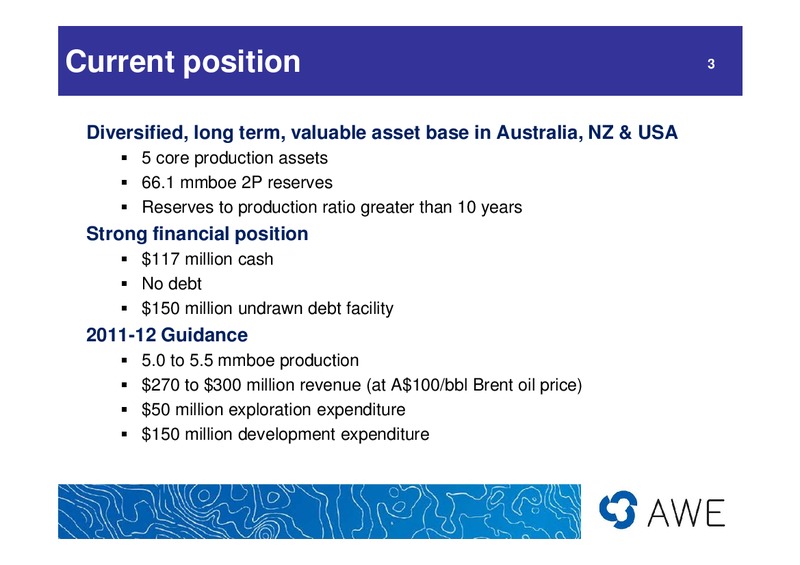
Current position 3 Diversified, long term, valuable asset base in Australia, NZ & USA 5 core production assets 66.1 mmboe 2P reserves Reserves to production ratio greater than 10 years Strong financial position 117 million cash…
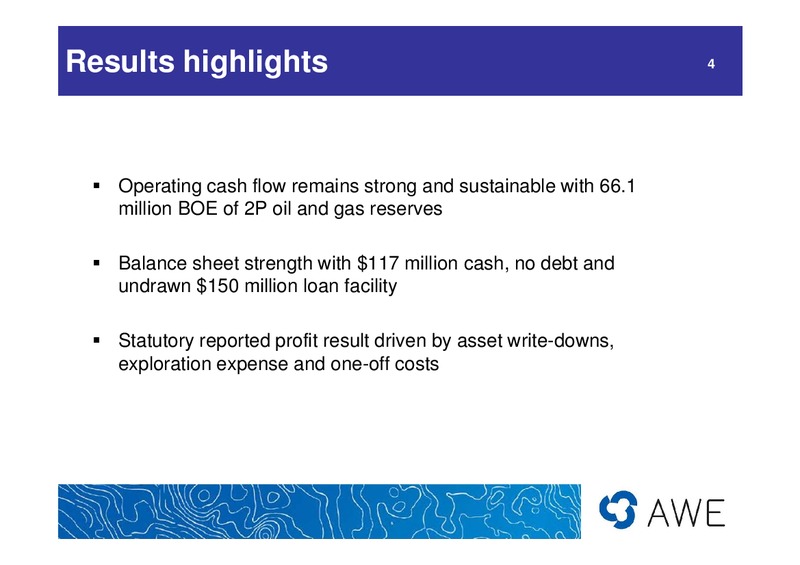
Results highlights 4 Operating cash flow remains strong and sustainable with 66.1 million BOE of 2P oil and gas reserves Balance sheet strength with 117 million cash, no debt and undrawn 150 million loan facility Statutory…
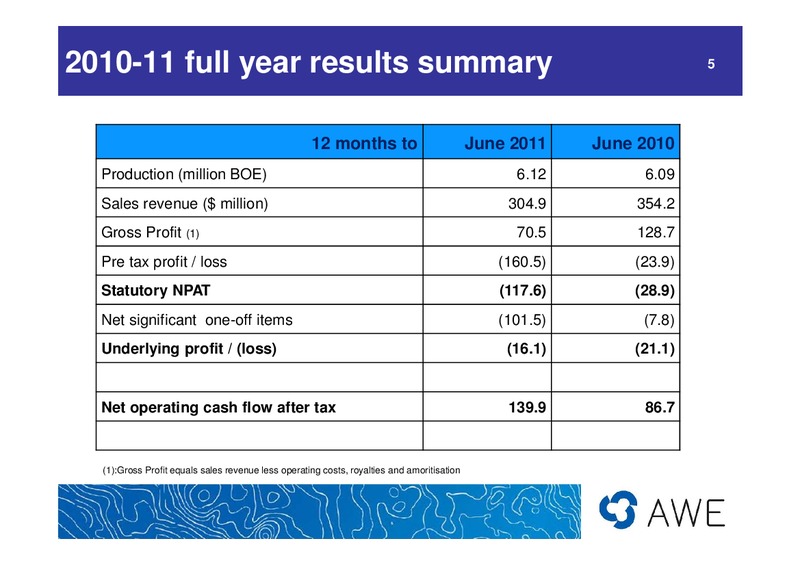
2010-11 full year results summary 5 12 months to June 2011 June 2010 Production (million BOE) 6.12 6.09 Sales revenue ( million) 304.9 354.2 Gross Profit (1) 70.5 128.7 Pre tax profit / loss (160.5) (23.9) Statutory NPAT (117.6)…
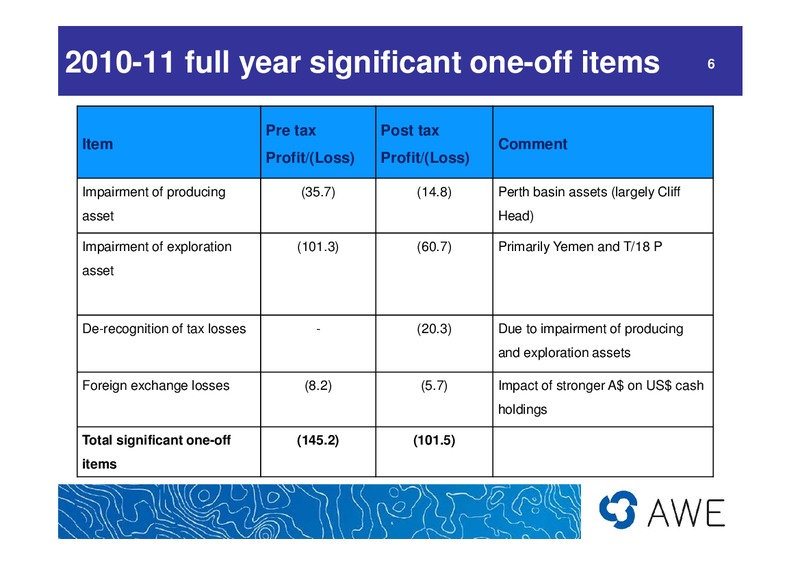
2010-11 full year significant one-off items 6 Pre tax Post tax Item Comment Profit/(Loss) Profit/(Loss) Impairment of producing (35.7) (14.8) Perth basin assets (largely Cliff asset Head) Impairment of exploration (101.3)…
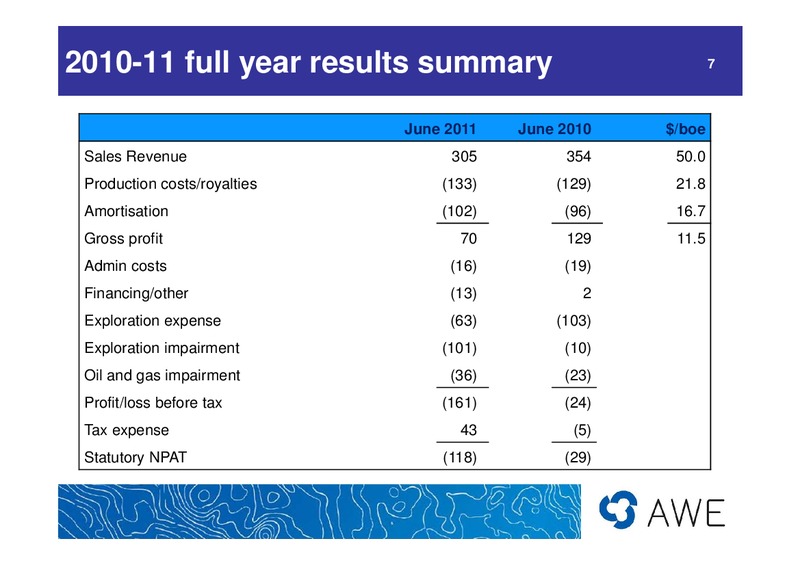
2010-11 full year results summary 7 June 2011 June 2010 /boe Sales Revenue 305 354 50.0 Production costs/royalties (133) (129) 21.8 Amortisation (102) (96) 16.7 Gross profit 70 129 11.5 Admin costs (16) (19) Financing/other (13)…
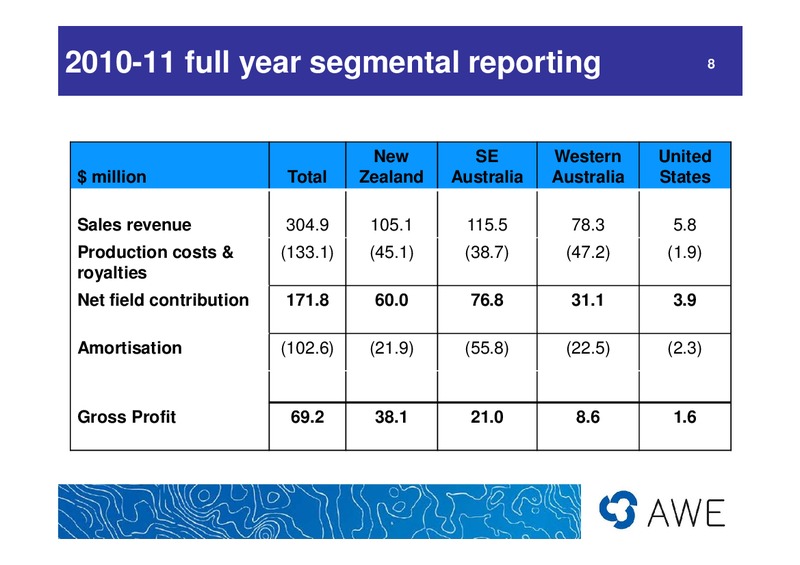
2010-11 full year segmental reporting 8 New SE Western United million Total Zealand Australia Australia States Sales revenue 304.9 105.1 115.5 78.3 5.8 Production costs & (133.1) (45.1) (38.7) (47.2) (1.9) royalties Net field…
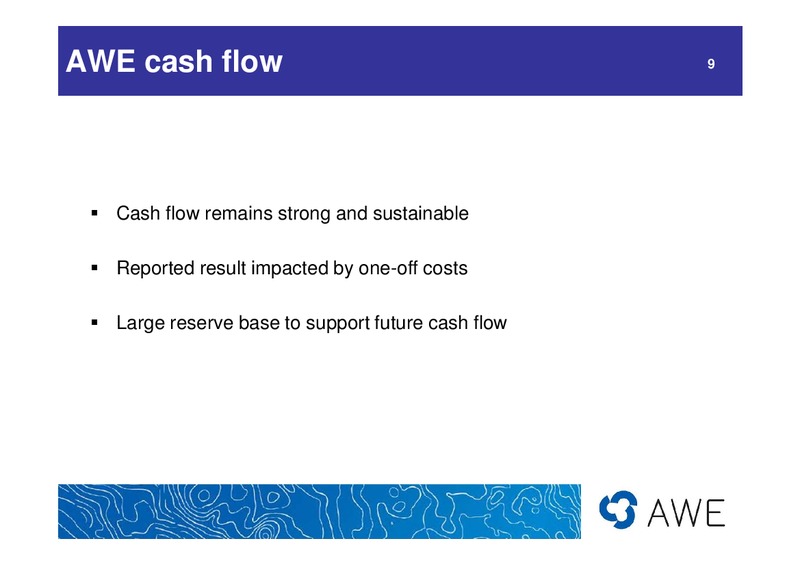
AWE cash flow 9 Cash flow remains strong and sustainable Reported result impacted by one-off costs Large reserve base to support future cash flow
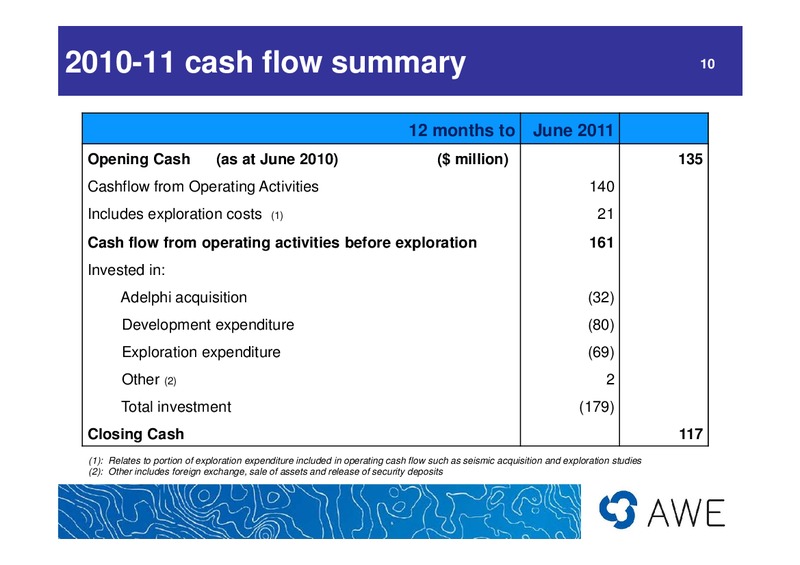
2010-11 cash flow summary 10 12 months to June 2011 Opening Cash (as at June 2010) ( million) 135 Cashflow from Operating Activities 140 Includes exploration costs (1) 21 Cash flow from operating activities before exploration…
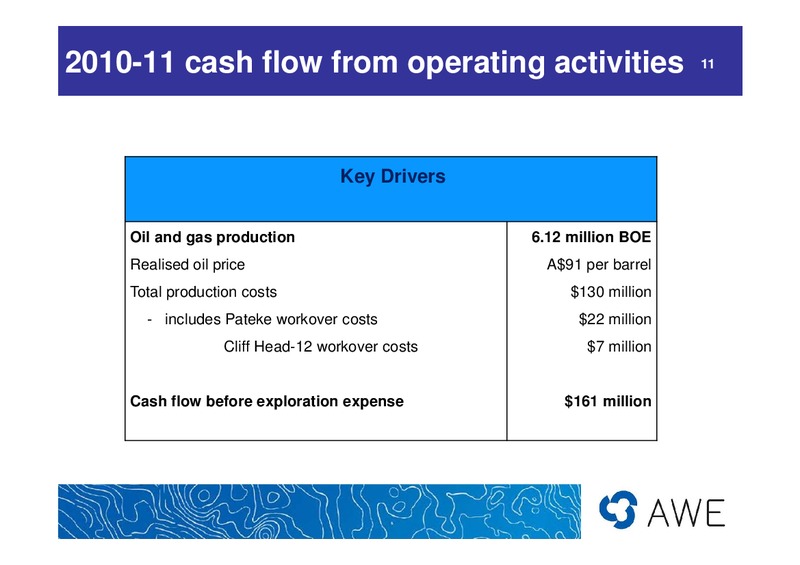
2010-11 cash flow from operating activities 11 Key Drivers Oil and gas production 6.12 million BOE Realised oil price A91 per barrel Total production costs 130 million - includes Pateke workover costs 22 million Cliff Head-12…
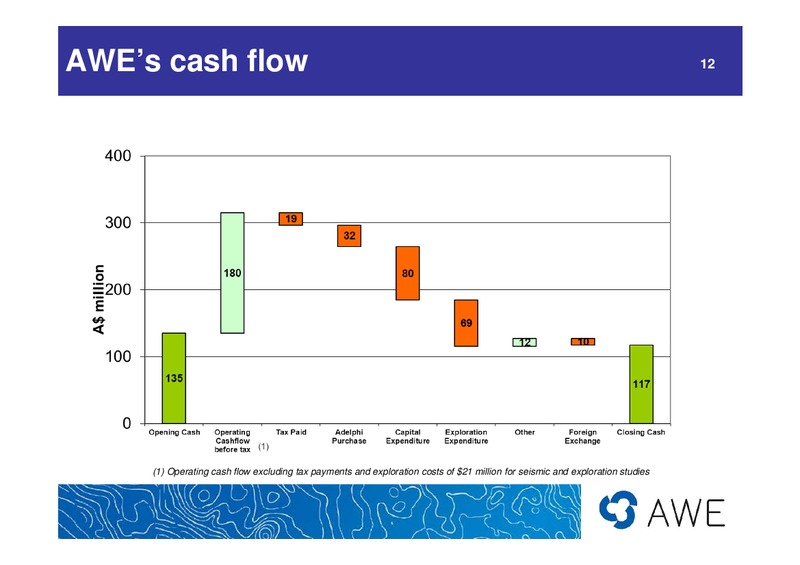
AWEs cash flow 12 (1) (1) Operating cash flow excluding tax payments and exploration costs of 21 million for seismic and exploration studies
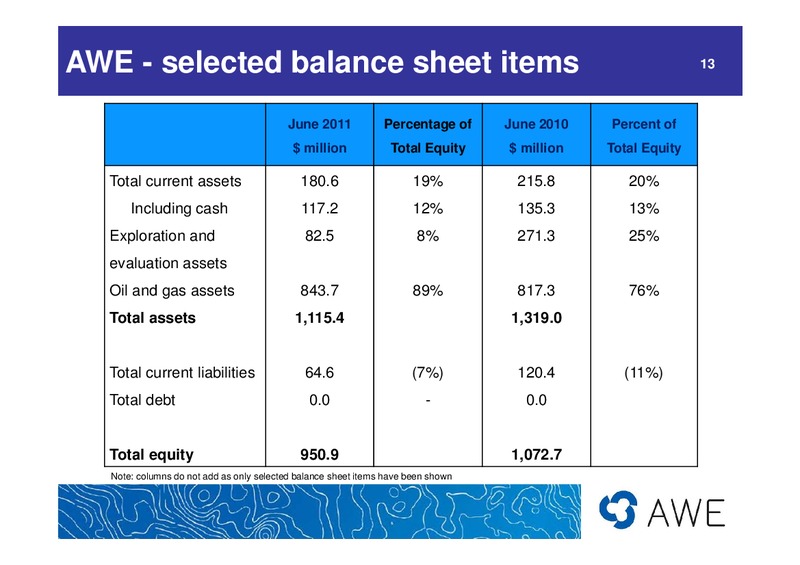
AWE - selected balance sheet items 13 June 2011 Percentage of June 2010 Percent of million Total Equity million Total Equity Total current assets 180.6 19% 215.8 20% Including cash 117.2 12% 135.3 13% Exploration and 82.5 8%…
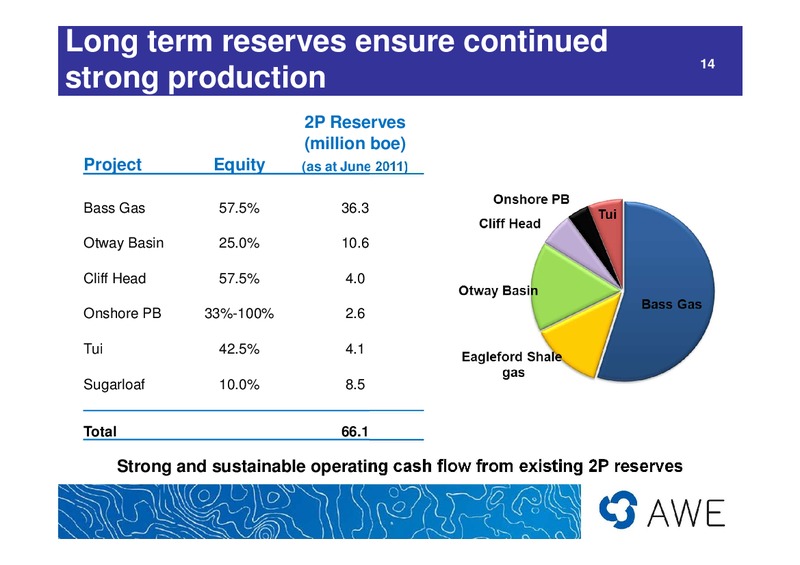
Long term reserves ensure continued 14 strong production 2P Reserves (million boe) Project Equity (as at June 2011) Bass Gas 57.5% 36.3 Otway Basin 25.0% 10.6 Cliff Head 57.5% 4.0 Onshore PB 33%-100% 2.6 Tui 42.5% 4.1…
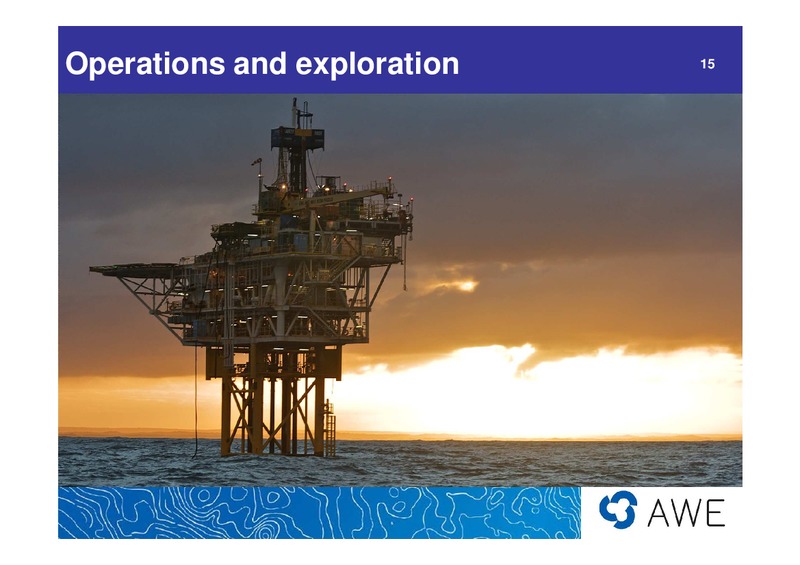
Operations and exploration 15
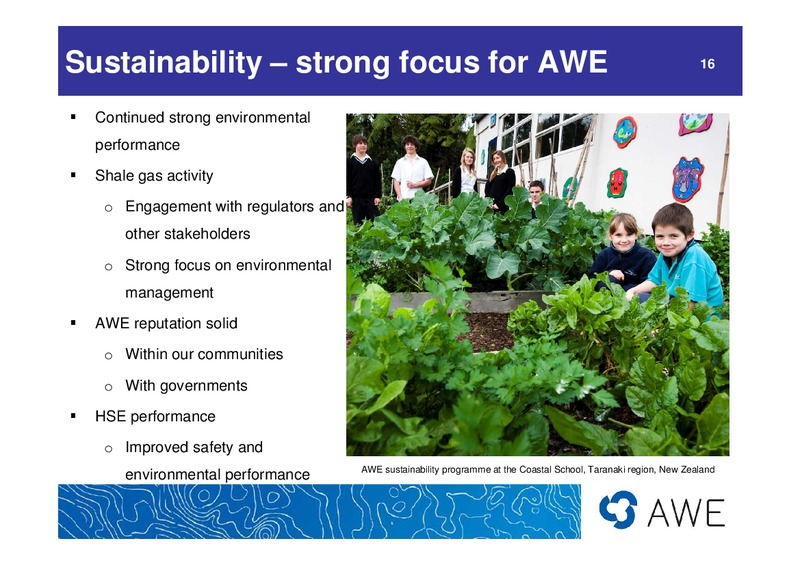
Sustainability strong focus for AWE 16 Continued strong environmental performance Shale gas activity o Engagement with regulators and other stakeholders o Strong focus on environmental management AWE reputation solid o…
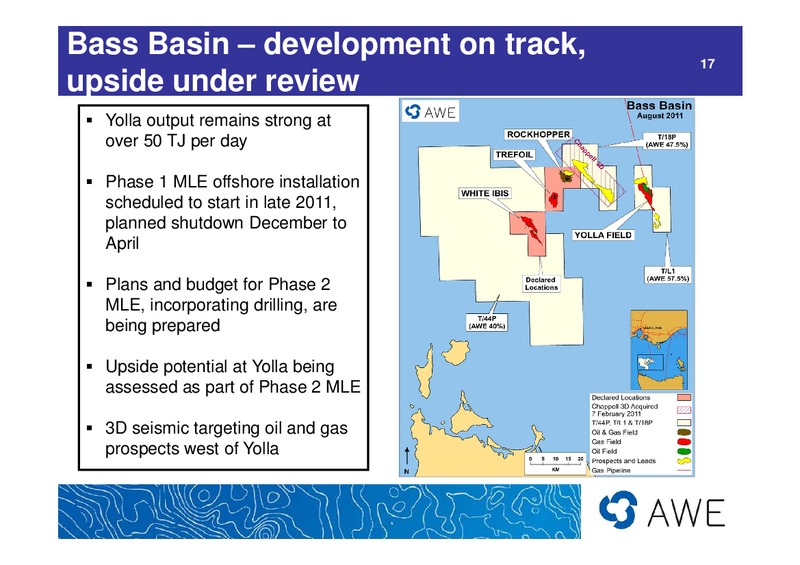
Bass Basin development on track, 17 upside under review Yolla output remains strong at over 50 TJ per day Phase 1 MLE offshore installation scheduled to start in late 2011, planned shutdown December to April Plans and budget for…
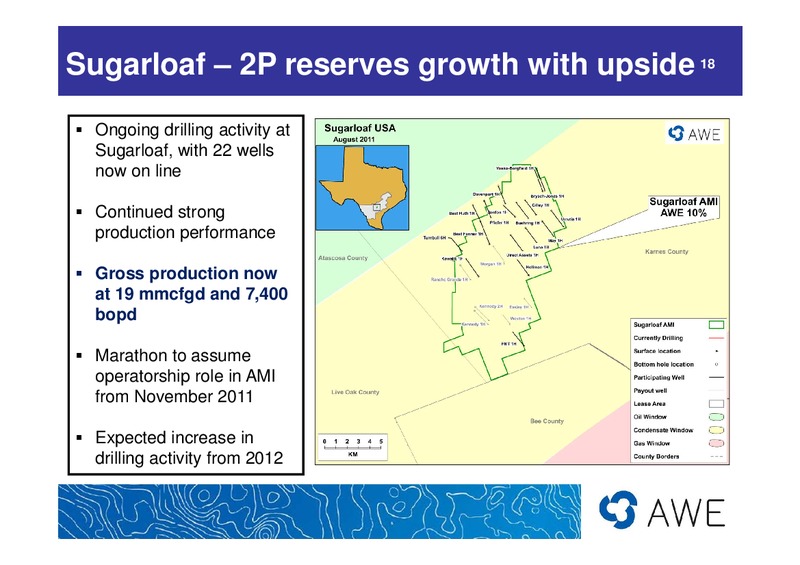
Sugarloaf 2P reserves growth with upside 18 Ongoing drilling activity at Sugarloaf, with 22 wells now on line Continued strong production performance Gross production now at 19 mmcfgd and 7,400 bopd Marathon to assume…
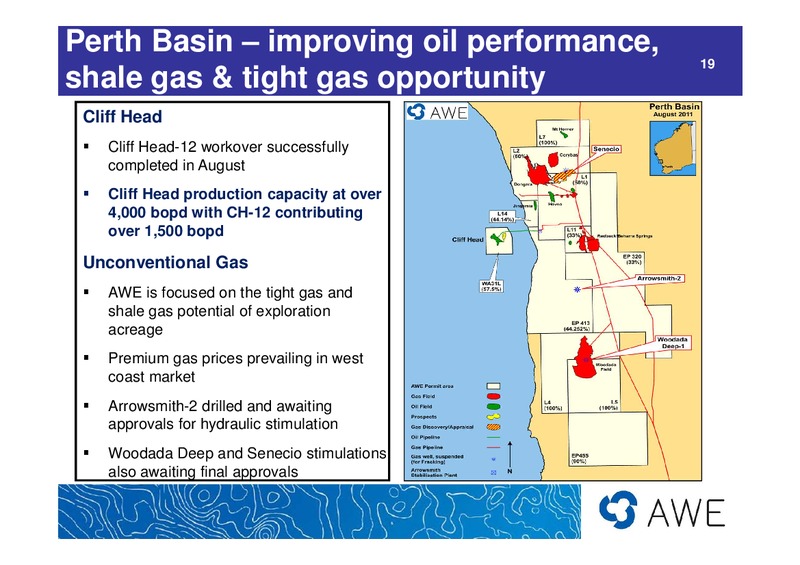
Perth Basin improving oil performance, 19 shale gas & tight gas opportunity Cliff Head Cliff Head-12 workover successfully completed in August Cliff Head production capacity at over 4,000 bopd with CH-12 contributing over 1,500…
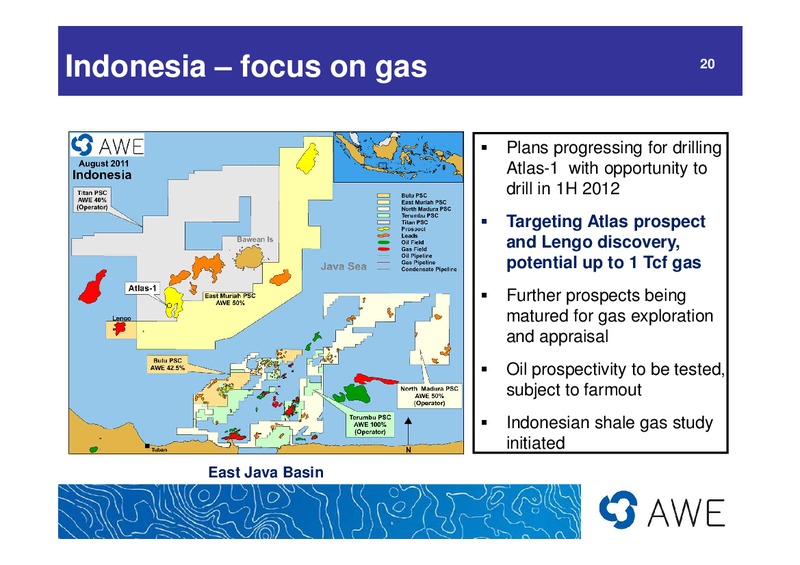
Indonesia focus on gas 20 Plans progressing for drilling Atlas-1 with opportunity to drill in 1H 2012 Targeting Atlas prospect and Lengo discovery, potential up to 1 Tcf gas Further prospects being matured for gas exploration…
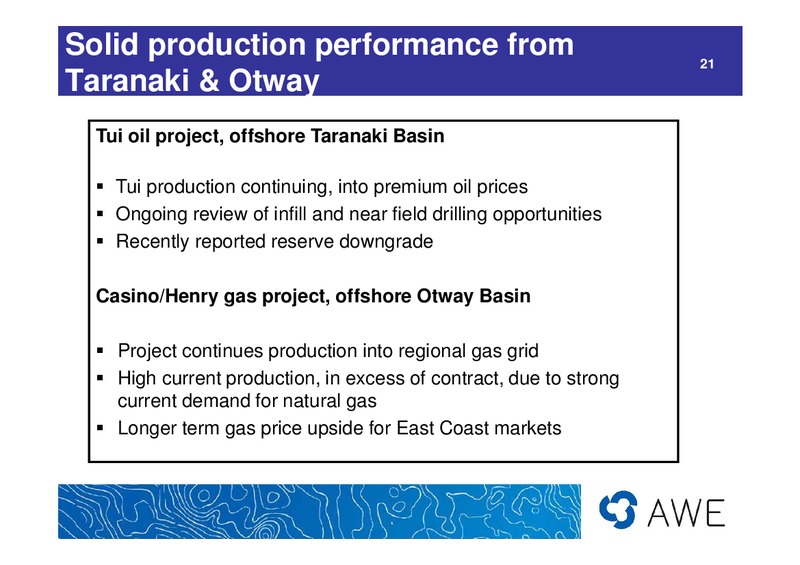
Solid production performance from 21 Taranaki & Otway Tui oil project, offshore Taranaki Basin Tui production continuing, into premium oil prices Ongoing review of infill and near field drilling opportunities Recently reported…
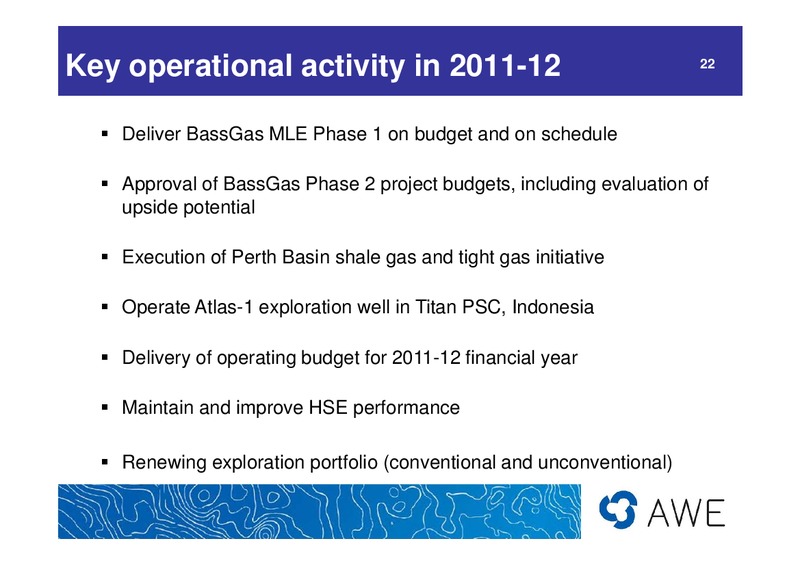
Key operational activity in 2011-12 22 Deliver BassGas MLE Phase 1 on budget and on schedule Approval of BassGas Phase 2 project budgets, including evaluation of upside potential Execution of Perth Basin shale gas and tight gas…
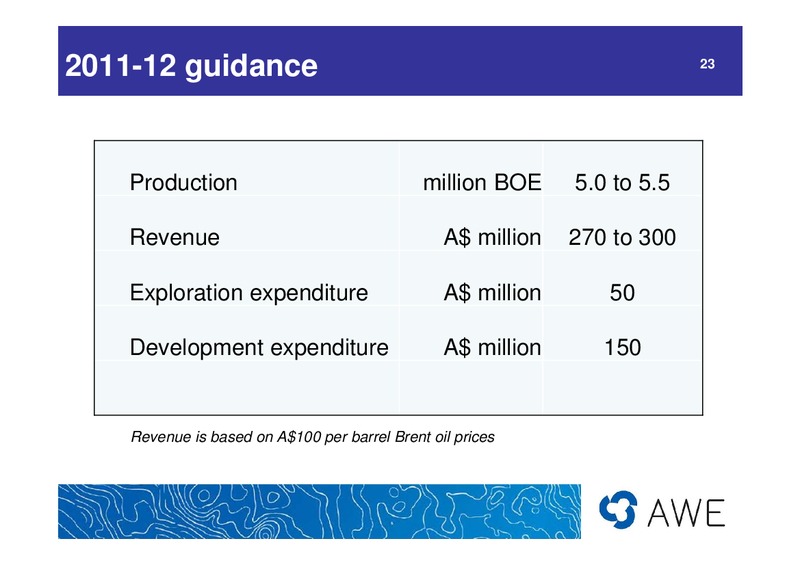
2011-12 guidance 23 Production million BOE 5.0 to 5.5 Revenue A million 270 to 300 Exploration expenditure A million 50 Development expenditure A million 150 Revenue is based on A100 per barrel Brent oil prices
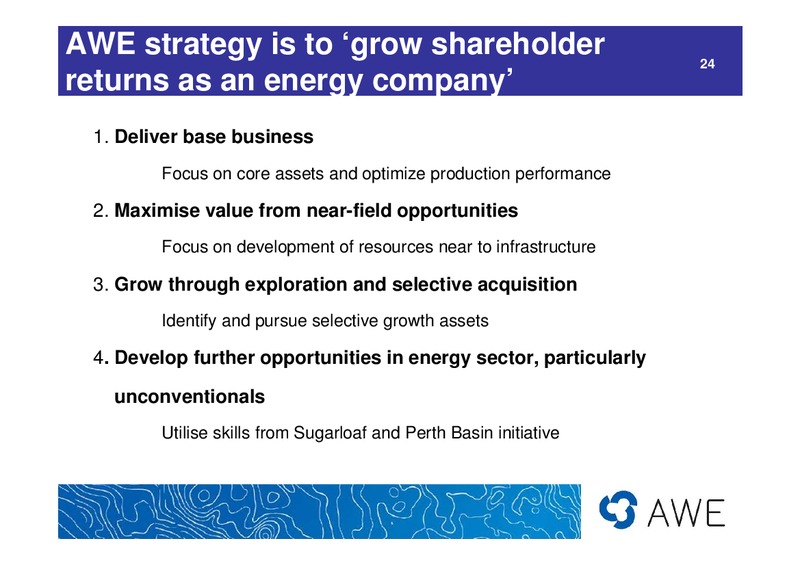
AWE strategy is to grow shareholder 24 returns as an energy company 1. Deliver base business Focus on core assets and optimize production performance 2. Maximise value from near-field opportunities Focus on development of resources…
Summary 25 Strong production performance and cash flow delivery Quality balance sheet Statutory profit result impacted by asset impairments, exploration expense and one-off costs Sugarloaf shale gas performing well, with…
 Loading...