2012 Half Year Results Bruce Clement Managing Director Introduction & Highlights
Financial highlights Half year statutory net profit of 29.7 million Sales revenue of 157.6 million EBIT 50.2 million Underlying profit 19.5 million1 Fully franked special dividend of 5 cent per share Net after tax operating…
Operational highlights Production of 2.94 million BOE demonstrating strength of base business Sale of 11.25% interest in Bass Basin Project for 80 million Reduced exposure to MLE Project Release of capital to reinvest in growth…
Deliver the strategy Maximise Develop Grow through Deliver base near-field opportunities in exploration & business opportunities New Energy acquisitions Focus on core Focus on delivery Utilise skills from Identify and pursue…
Solid performance by base business Dec 2011 Dec 2010 Statutory NPAT 29.7 (49.8) EBIT 50.2 (65.7) Sales revenue ( million) 157.6 134.6 Production (million BOE) 2.94 3.12 Underlying profit / (loss)1 19.5 (33.8) Net operating cash…
Earnings analysis EBIT 50.2 million 12.7 million pre-tax profit on sale of shares in Buru Energy Limited Exploration expense of 9.7 million, down 36.6 million Field operating costs 54.4 million, down 16 million Solid…
Production performance Total production of 2.9 million BOE Tui production continuing with high oil prices and strong FPSO operating performance Improved Cliff Head-12 oil production Planned shutdown at BassGas for the…
Sales revenue improving Sales revenue of 157.6 million,17% higher Higher realised oil prices during the period Strong production performance Rising east coast gas prices Sales revenue up on prior corresponding period and on…
Continued strong cash flows Operating cash flow of 75 million for the 6 month period Cash position of 167 million Fully franked dividend of 5 cents per share paid in January 2012, 26 million No gearing and an undrawn debt…
2012 Half Year Results Bruce Clement Managing Director Operational & Strategic Update
Australian based, Asia and US focused AWE well placed to grow in key energy markets Slide 14
Hydrocarbons account for 50% of global energy demand World energy demand forecast to rise by 1.6% p.a. over the next 25 years (by 113 million boed to 364 million boed) Gas and Liquids account for just over 50% through this…
Asia Pacific region accounts for 38% of world energy demand Asia accounts for approximately 38% of total global energy consumption. This share is expected to grow to over 44% by 2035 Australia/NZ consumption is currently small - 1% of…
Energy price projections The U.S. EIA forecasts average oil prices to rise substantially over the next 20 years East Australian gas prices are currently low by regional equivalents, and are expected to rise as LNG exports commence…
AWE now has approximately 174 million BOE of reserves plus resources (2P + 2C) 21 million barrels of 2P liquid reserves An additional 43 million BOE net contingent oil resources from AAL acquisition Total 87 million barrels of…
40% of AWEs Australian 2P gas reserves and 75% of 2P+2C gas resources remain uncontracted 36 million BOE 2P gas reserves Additional 51 million BOE 2C gas resources AWE is well placed to take advantage of future gas price…
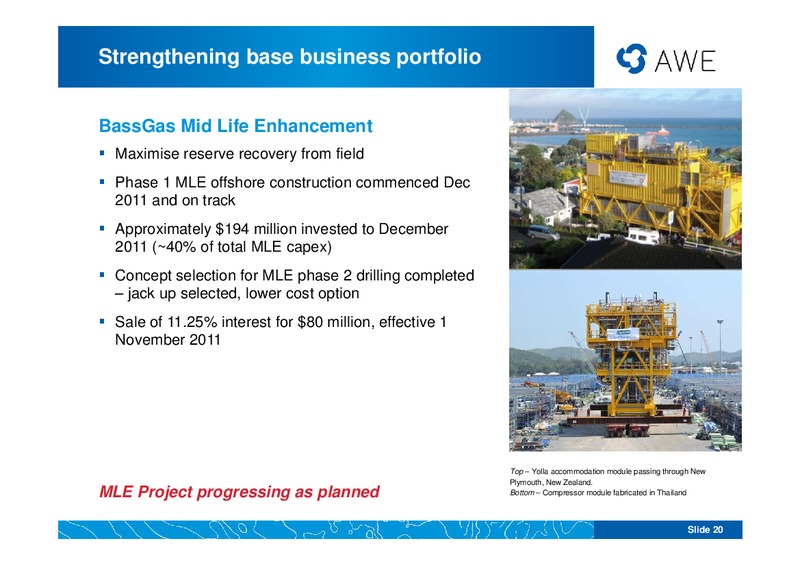
Strengthening base business portfolio BassGas Mid Life Enhancement Maximise reserve recovery from field Phase 1 MLE offshore construction commenced Dec 2011 and on track Approximately 194 million invested to December 2011 (40% of…
Strengthening base business portfolio Cliff Head Oil Field Successful workover of Cliff Head-12 Improved production performance Reviewing further opportunities to optimise field performance Tui Oil Fields Two planned maintenance…
Growth in New Energy opportunities Eagle Ford Sugarloaf Development (USA) Marathon has acquired operatorship 25 wells planned for 2H FY2012 Recent Marubeni Corp acquisition in Eagle Ford reaffirms valuation Perth Basin (Australia)…
Recent Indonesian acquisition underpins transformation Acquisition of 100% of Northwest Natuna & Anambas PSCs (as operator) containing: Ande Ande Lumut oil field (estimated to contain 76 million barrels of recoverable oil) Anambas…
Ande Ande Lumut oilfield development technical characteristics Subsurface Characteristics Estimated 76 million barrels recoverable oil (26% recovery factor) Oil column: up to 36 metres Oil characteristics 14.2 API gravity; and…
Strategic initiatives undertaken to rebalance portfolio Net 2P Net 2P + 2C AAL Pre AAL & Bass Gas sale Resources (as at 31 Dec 2011) Post Bass Gas sale A more balanced portfolio by product and geography, spreading risk and…
AWE positioned for value and growth Maximise Develop Grow through Deliver base near-field opportunities in exploration & business opportunities New Energy acquisitions Focus on core Focus on delivery Utilise skills from…
2012 Half Year Results Appendix
6 monthly earnings breakdown 6 months to 6 months to Dec 2011 Dec 2010 million million Revenue 158.6 135.8 Operating costs (54.4) (70.4) Amortisation (48.3) (48.6) Exploration costs expensed (9.7) (46.3) Asset impairments/reversals…
Underlying Profit millions 6 months to Comment Dec 2011 Statutory NPAT 29.7 Profit on sale of Buru shares 12.2 Disposal of shares in Buru Energy Impairment of assets (2.9) 11.25% sale of Bass Basin portfolio Foreign exchange…
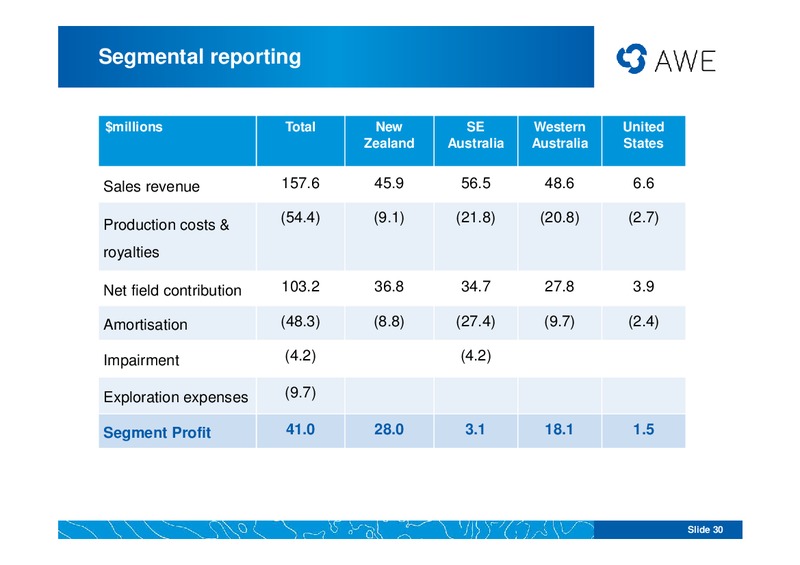
Segmental reporting millions Total New SE Western United Zealand Australia Australia States Sales revenue 157.6 45.9 56.5 48.6 6.6 Production costs & (54.4) (9.1) (21.8) (20.8) (2.7) royalties Net field contribution 103.2 36.8…
Cashflow analysis 6 months to 6 months to Dec 2011 Dec 2010 million million Opening Cash 117.2 135.3 Net cashflow from operations 75.4 40.7 Asset acquisitions (Adelphi and BassGas) - (33.9) Development spending (43.7) (47.0)…
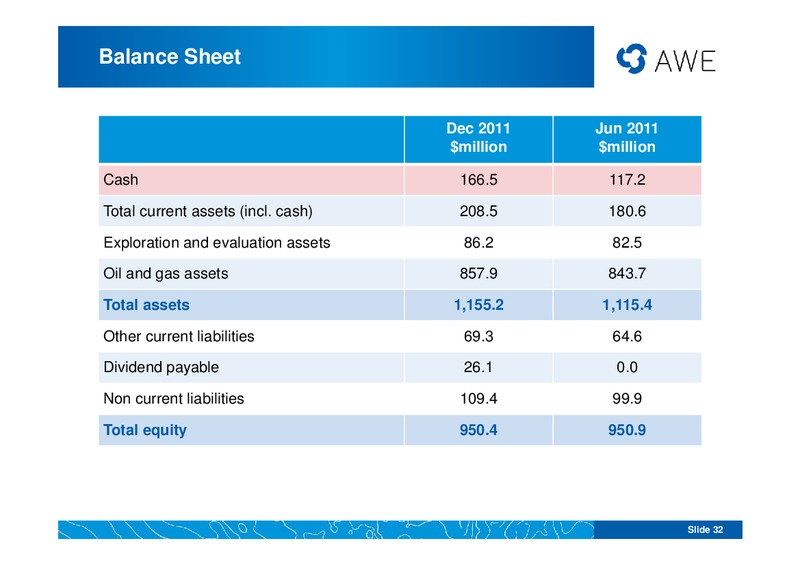
Balance Sheet Dec 2011 Jun 2011 million million Cash 166.5 117.2 Total current assets (incl. cash) 208.5 180.6 Exploration and evaluation assets 86.2 82.5 Oil and gas assets 857.9 843.7 Total assets 1,155.2 1,115.4 Other current…
 Loading...