Newman Interim results Half year ended 31 December 2013 Andrew Mackenzie Chief Executive Officer Graham Kerr Chief Financial Officer 18 February 2014
Gulf of Mexico Escondida Interim results Half year ended 31 December 2013 Andrew Mackenzie Chief Executive Officer 18 February 2014
Key themes Record operational performance and strong production growth Sustainable productivity gains of US4.9 billion now embedded Capital and exploration expenditure to decline by 25% this year Competition for capital will drive…
Safety is paramount Total Recordable Injury Frequency (TRIF) (number of recordable injuries per million hours worked) 10 8 6 4 2 0 FY05 FY06 FY07 FY08 FY09 FY10 FY11 FY12 FY13 H1 FY14 Interim results, 18…
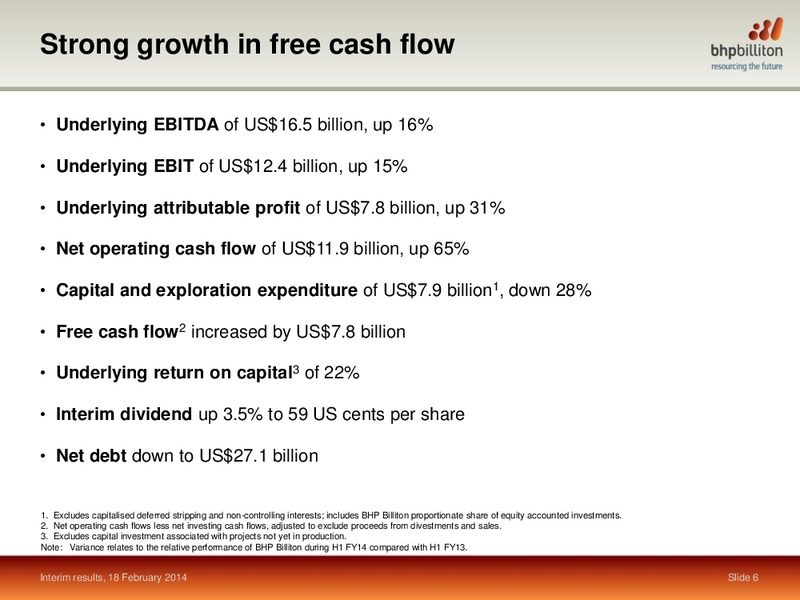
Strong growth in free cash flow Underlying EBITDA of US16.5 billion, up 16% Underlying EBIT of US12.4 billion, up 15% Underlying attributable profit of US7.8 billion, up 31% Net operating cash flow of US11.9 billion, up 65%…
Production records achieved at 10 operations Record Western Australia Iron Ore (WAIO) Strong and predictable operating performance production, up 20% to 108 mt1, with full year (production volumes, % change, H1 FY14 versus H1 FY13)…
Selective investment and productivity gains underpin strong momentum Production guidance maintained for FY14 Production growth contribution1 (%, FY13 to FY15) iron ore production of 192 mt 20 petroleum production of 250 MMboe…
Newman Interim results Half year ended 31 December 2013 Graham Kerr Chief Financial Officer 18 February 2014
Other items affecting profitability Other items (US million) EBITDA Tax 500 250 0 (250) Onshore US Onshore US UK pension plan Balance sheet Remeasurement of rig termination charges underutilised gas charges monetary items…
Productivity is delivering sustainable growth in margins and returns Controllable cash costs1 EBIT variance (US million) (US billion, H1 FY14 versus H1 FY13) 1,200 275 1,047 129 20.0 325 71 600 247 0 Equipment People Supply Other…
US4.9 billion1 of cost and volume efficiencies now embedded Productivity led cost and volume efficiencies1 (US billion) 1.5 4.9 5.0 1.6 2.5 1.8 0.0 Operating Exploration Productivity Total cash costs & business volumes…
Our framework to maximise shareholder returns Our purpose when allocating capital is to maximise total shareholder returns Our strategy is to own and operate large, long life, low cost, expandable, upstream assets diversified by…
A strong track record of capital management Over the last 10 years we returned Capital US62 billion1 to our shareholders return a payout ratio of 50% US100 invested in BHP Billiton a decade ago would have a value of US4663 today…
Applying strict capital discipline Return excess Strong balance We are committed to a solid A credit rating to shareholders sheet & solid A credit rating 65% increase in net operating cash flow proceeds of US2.2 billion1 from…
Applying strict capital discipline Strong balance Return excess Our progressive base dividend has been to shareholders sheet & solid A credit rating maintained throughout the economic cycle it is the minimum annual distribution…
Applying strict capital discipline Strong balance Return excess By reducing annual expenditure, we have to shareholders sheet & solid A credit rating significantly increased internal competition for capital 25% reduction in…
Applying strict capital discipline Strong balance Return excess We have consistently returned excess to shareholders sheet & solid A credit rating capital to shareholders completed buy-backs totalling US23 billion1 over the last…
Competition for capital will increase returns Our opportunity rich portfolio remains a key point of differentiation By continuing to operate within a disciplined Maximise framework and by testing all decisions against shareholder…
Primed to increase shareholder returns We have delivered a significant increase in free cash flow Capital and exploration expenditure is expected to decline by 25% in FY14, as planned An average rate of return of 20%1 for our…
BMA Interim results Half year ended 31 December 2013 Andrew Mackenzie Chief Executive Officer 18 February 2014
Unlocking shareholder value through productivity We committed to deliver more tonnes and BMA 797 truck performance (Goonyella) more barrels from existing infrastructure at (hours, 12 month moving average, index, July 2012=100) a lower…
Unlocking shareholder value through productivity We committed to deliver more tonnes and Coal productivity gains2 more barrels from existing infrastructure at (US billion) a lower unit cost 3.0 Our culture, capability and systems…
Unlocking shareholder value through productivity We committed to deliver more tonnes and Iron Ore productivity gains2 more barrels from existing infrastructure at (US billion) a lower unit cost 0.6 0.3 Our culture, capability and…
Generating a sustainable increase in return on capital Strong operating performance and an Return on capital intense focus on productivity has delivered (earnings to average capital employed1, %) an increase in the Groups Underlying…
Global growth is broad based and improving Global economic conditions improved Private sector driving recent US growth during H1 FY14 (% QoQ, annualised) 5.0 In the United States, growth has accelerated as private sector confidence…
Markets will respond to supply growth With the displacement of high cost supply, The iron ore cost curve will flatten the marginal cost of production for iron ore (US/t) will decline CY13 current steep cost curve contributes to…
Our portfolio approach to capital allocation Maximise Saskatchewan shareholder (Potash) returns Onshore US (Oil & gas) Gulf of Mexico (Oil & gas) WAIO Queensland Coal (Iron ore) (Metallurgical coal) Escondida…
An increasing focus on our major basins Production growth1 Capital & exploration expenditure3 (%, FY13 to FY15) (US million) 30 24 Major basins2 24 16 18 8 Group2 12 0 30 35 40 45 50 55 FY12 FY13 FY14e Saskatchewan EBIT…
Key themes Record operational performance and strong production growth Sustainable productivity gains of US4.9 billion now embedded Capital and exploration expenditure to decline by 25% this year Competition for capital will drive…
Appendix
Strength in diversity EBIT margin (%) 75 50 25 0 FY05 FY06 FY07 FY08 FY09 FY10 FY11 FY12 FY13 H1 FY14 Petroleum & Potash Aluminium, Manganese & Nickel Copper Iron Ore Coal Group Note: All periods exclude third party…
Impact of commodity price movements Total price variance1 (US million, H1 FY14 versus H1 FY13) 1,000 815 (14) 500 (306) 0 (611) (500) (658) (774) (1,000) Iron Ore Petroleum Aluminium, Coal Copper Total Manganese &…
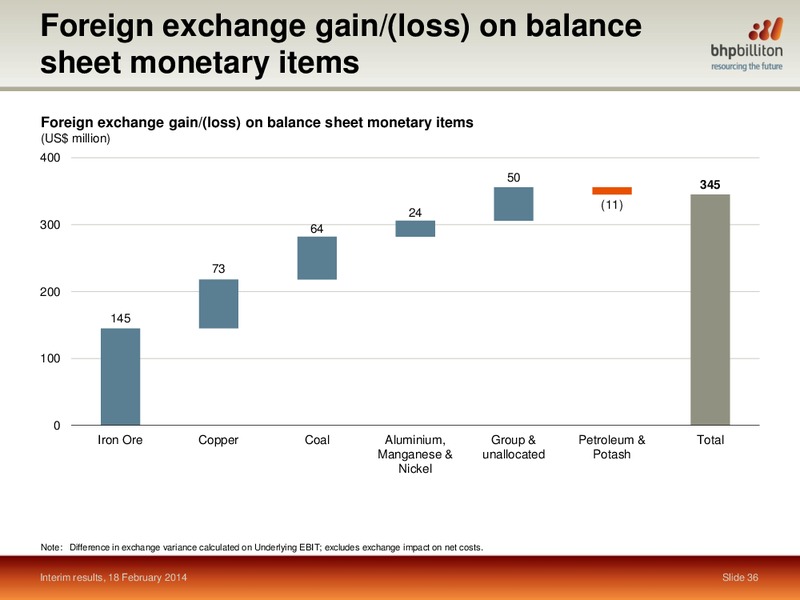
Foreign exchange gain/(loss) on balance sheet monetary items Foreign exchange gain/(loss) on balance sheet monetary items (US million) 400 50 345 (11) 24 300 64 73 200 145 100 0 Iron Ore Copper Coal Aluminium, Group &…
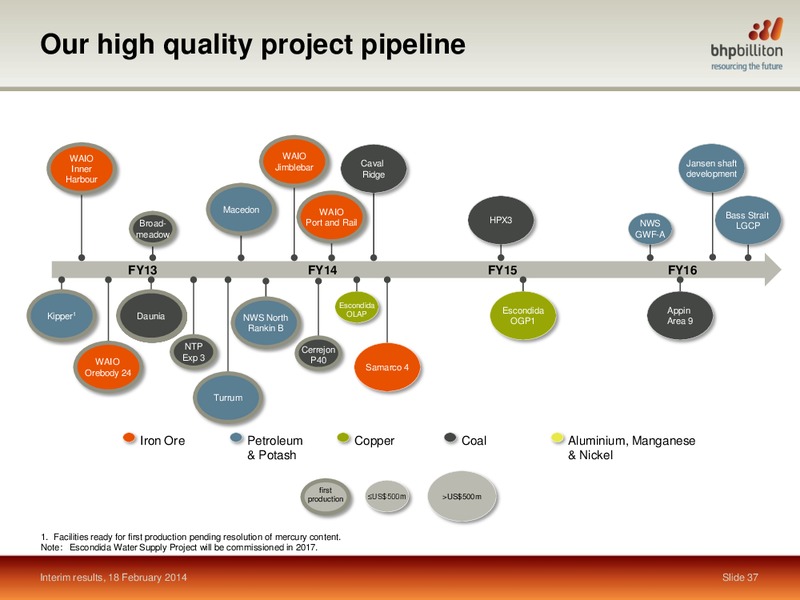
Our high quality project pipeline WAIO WAIO Jimblebar Caval Jansen shaft Inner Ridge development Harbour Macedon WAIO Bass Strait Broad- Port and Rail HPX3 NWS LGCP meadow GWF-A FY13 FY14 FY15 FY16 Escondida OLAP…
Maturity profile analysis Debt balances1 (US billion2) 7 6 5 4 3 2 1 0 FY14 FY15 FY16 FY17 FY18 FY19 FY20 FY21 FY22 FY23 FY24 FY25 FY26 FY27 FY28 Post FY28 US Euro Sterling A C CP Bonds Bonds Bonds Bonds Bonds Issuance…
Key net profit sensitivities Approximate impact1 on FY14 net profit after tax of changes of US million US1/t on iron ore price 120 US1/bbl on oil price 45 US10/MMbtu on US gas price 25 US1/t on metallurgical coal price 25…
 Loading...