BMA, Australia A tier 1 diversified growth portfolio Marius Kloppers Chief Executive Officer 10 May 2011
Agenda Supportive long term market fundamentals Well positioned for diversified, tier 1 growth Concluding remarks Bank of America Merrill Lynch Global Metals & Mining Conference, May 2011 Slide 3
Supportive long term market fundamentals, but volatility y to continue in the near term Longer term, global GDP growth to Global GDP growth rate (% per annum) remain robust 6 Developed economies Strong emerging market growth…
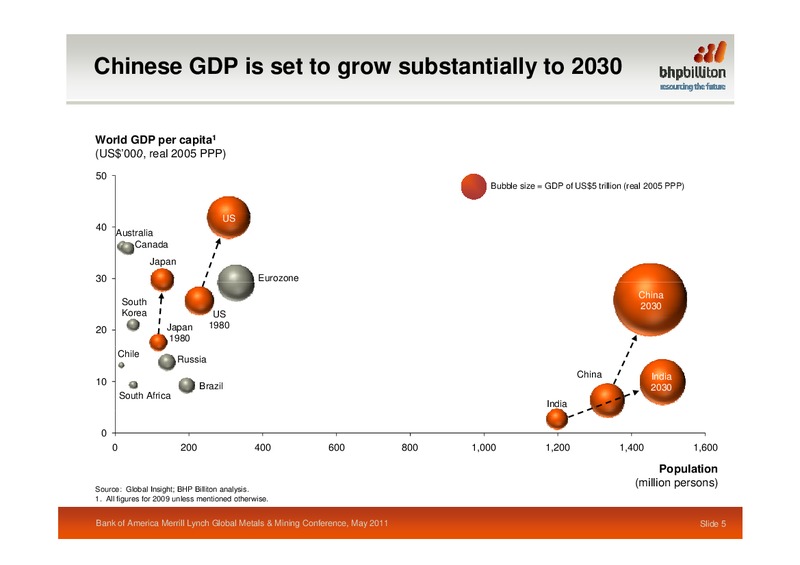
Chinese GDP is set to grow substantially to 2030 World GDP per capita1 (US000 (US 000, real 2005 PPP) 50 Bubble size = GDP of US5 trillion (real 2005 PPP) US 40 Australia Canada Japan 30 Eurozone China South 2030 Korea US…
Commodity intensity trends evolve with economic development p USA (Intensity index) 180 Emerging Developed economies economies Electricity 160 140 120 Copper 100 80 Steel 60 40 0 5 10 15 20 25 30 35 40 45 50 GDP per…
Commodity prices supported by under delivery of the supply pp y side Seaborne traded iron ore supply growth has failed to meet expectations Against g a strong g demand (mtpa) backdrop, supply growth has 600 fallen short of…
What makes a tier 1 resource Mineral Inventory Mi Mineral l Resource R on Mineralisatio xploration Range of Potential Advanced Ex Undiscovered M Mineralisation (Based on Exploration Results) Ore Reserve A…
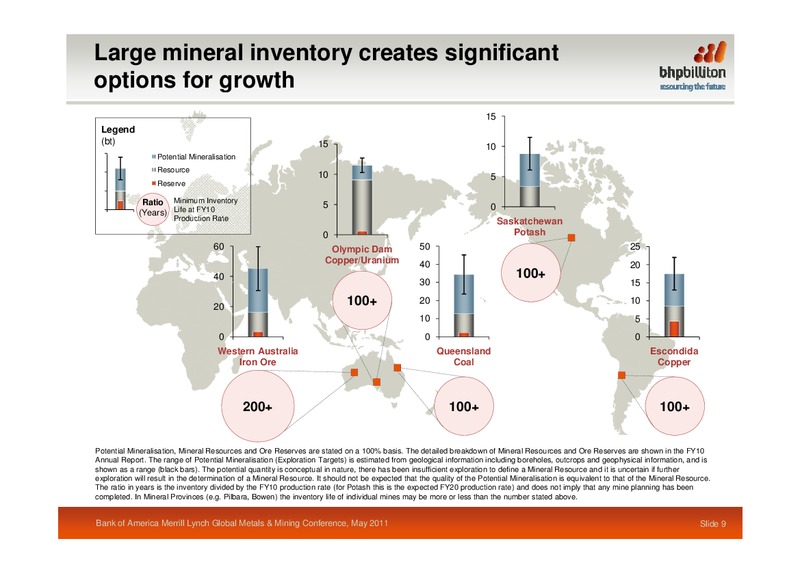
Large mineral inventory creates significant options p for growth g 15 Legend (bt) 15 10 P t ti l Mineralisation Potential Mi li ti Resource 10 5 Reserve Ratio Minimum Inventory 5 0 (Years) Life at FY10 Production Rate…
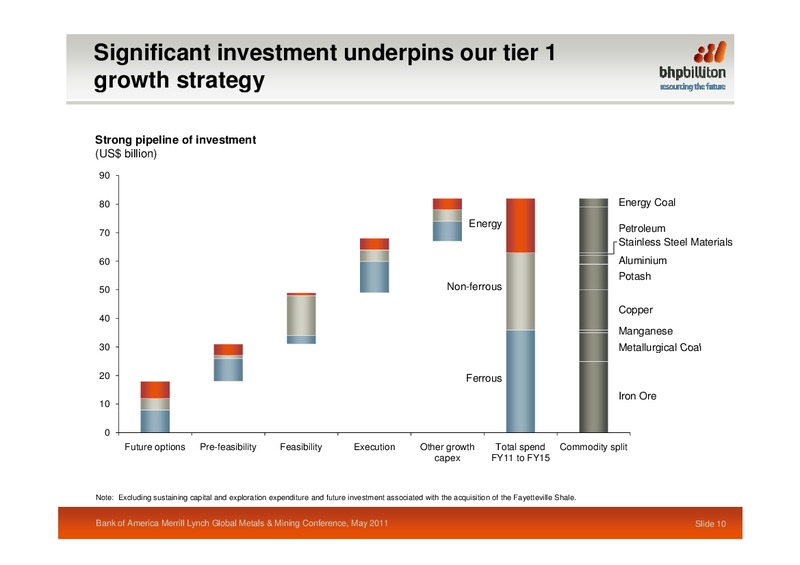
Significant investment underpins our tier 1 growth strategy g gy Strong pipeline of investment (US billion) 90 80 Energy Coal Energy Petroleum 70 Stainless Steel Materials 60 Aluminium Potash 50 Non-ferrous Copper 40…
Development activities clustered around our key y hubs Underlying EBIT (H1 FY11) Western Queensland Coal Australia Other Iron Ore Execution: Daunia Hay Point Stage 3 Expansion F Feasibility: ibilit Olympic Caval Ridge…
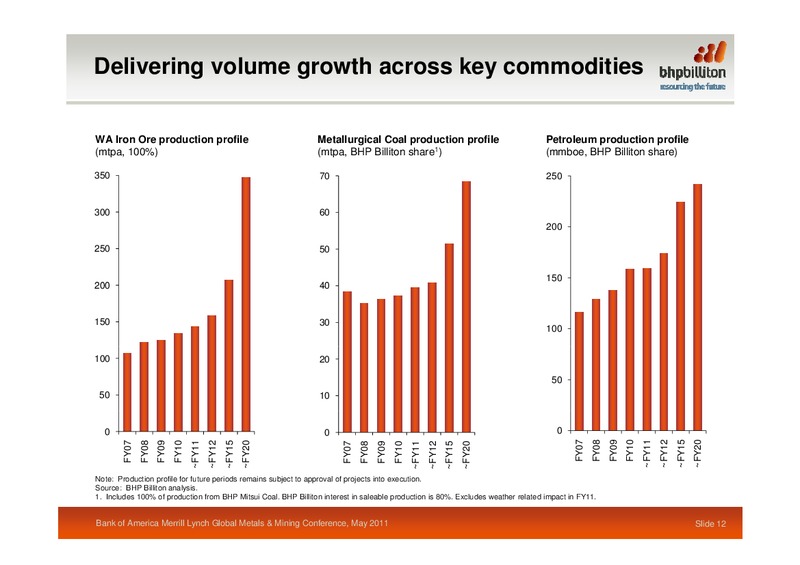
Delivering volume growth across key commodities WA Iron Ore production profile Metallurgical Coal production profile Petroleum production profile (mtpa 100%) (mtpa, (mtpa BHP Billiton share1) (mtpa, (mmboe BHP Billiton share) (mmboe,…
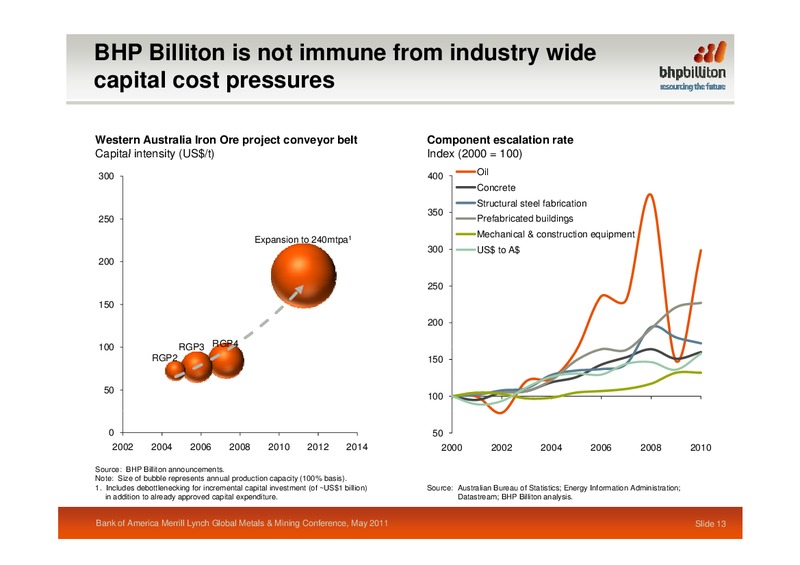
BHP Billiton is not immune from industry wide capital p cost pressures p Western Australia Iron Ore project conveyor belt Component escalation rate Capital intensity (US/t) Index (2000 = 100) 300 400 Oil Concrete Structural steel…
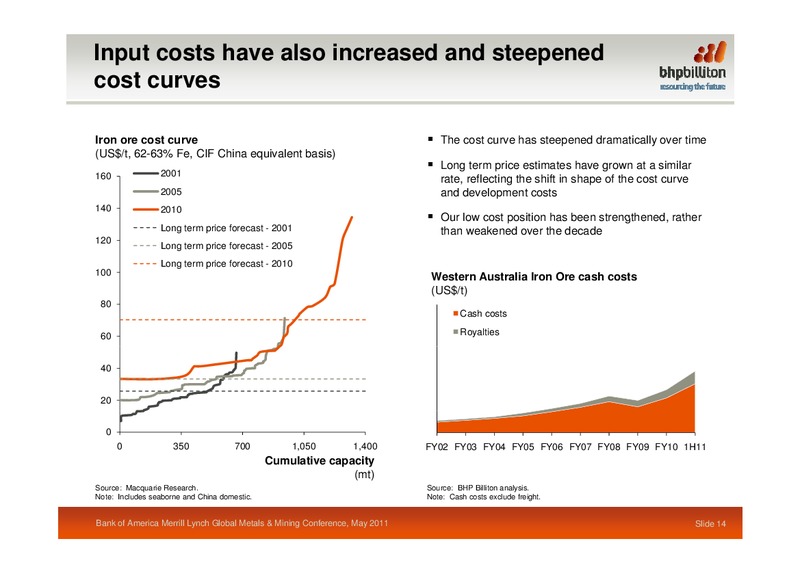
Input costs have also increased and steepened cost curves Iron ore cost curve The cost curve has steepened dramatically over time (US/t 62-63% Fe (US/t, Fe, CIF China equivalent basis) Long term price estimates have grown at a similar…
The value of a diversified tier 1 portfolio High return tier 1 assets The stability of a diversified portfolio Return on capital EBIT margin1 (%) (%) Petroleum Aluminium 50 100 B Base M Metals t l D&SP SSM Iron Ore Manganese…
A tier 1 diversified growth portfolio Long term demand growth remains i robust b t Supply likely to lag in the near term, but supply will catch up with term demand Capital intensity is increasing as new infrastructure is…
 Loading...