OPPORTUNITY RICH, TECHNICALLY DRIVEN June 10, 2014
Corporate Profile Production Q1 2014 Average 2,143 Boed Oil Weighting 95% light oil Net Debt & Working Capital Q1 2014 Exit 119.9 million Tax Pools (000s) COGPE & CDE 246,679 UCC 67,545 Non Capital Losses 96,516 Drilling…
Capitalization TSX-V Trading Symbol PRY Capital Structure Basic 217.2 million Dilutive Securities Average Price (0.50) 27.2 million Incentive Shares 4.8 million 249.2 million Insider Holdings Basic 13.0% Fully Diluted 22.5% 4
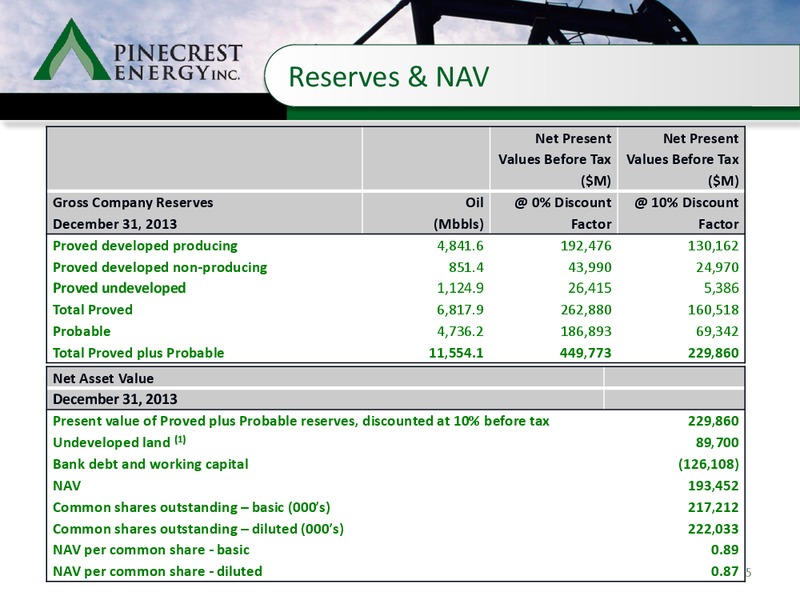
Reserves & NAV Net Present Net Present Values Before Tax Values Before Tax (M) (M) Gross Company Reserves Oil 0% Discount 10% Discount December 31, 2013 (Mbbls) Factor Factor Proved developed producing 4,841.6 192,476 130,162…
Operation Plan for H1 2014 H1 Goals Minimal capital on Remediation/Maintenance (4 MM) Debt repayment 10 MM Production Optimization Waterflood monitoring and adjusting 6
Red Earth Core Area Slave Point Exploitation Area Activity 584 mmbbls oil in place* 2,500 wells drilled through Slave Point zone 500 hz Slave Point licensed to date 400 industry horizontal wells drilled to date PRY - 270 sections (net)…
Pinecrest Normalized Type Wells Assumptions Capital 3,700 Fixed Op. Cost 6,000/well/month Variable Oil Op. Cost 5.25/Bbl Variable Gas Op. Cost N/A Pricing Sproule March 2014 Land Crown Sproule Type 3 Sproule Price Sensitivity Low Mar…
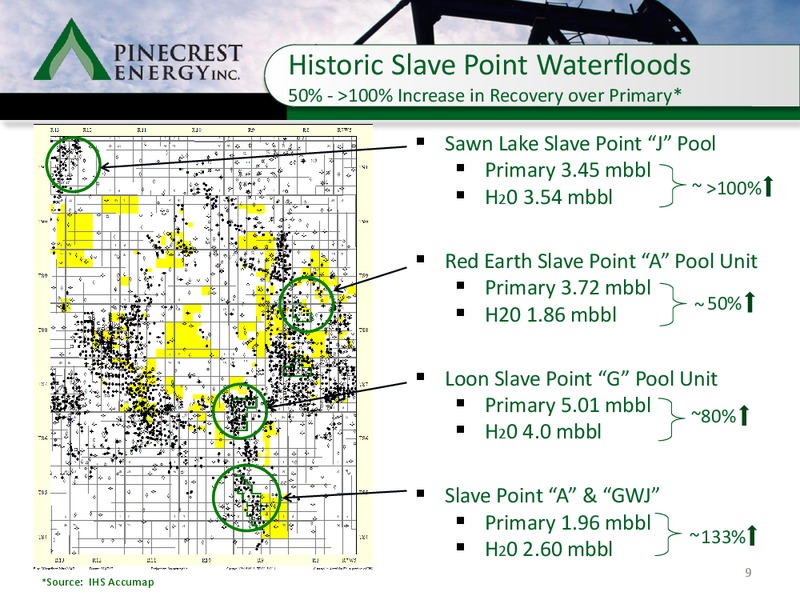
Historic Slave Point Waterfloods 50% - 100% Increase in Recovery over Primary* Sawn Lake Slave Point J Pool Primary 3.45 mbbl H20 3.54 mbbl 100% Red Earth Slave Point A Pool Unit Primary 3.72 mbbl H20 1.86 mbbl 50% Loon Slave Point G…
Red Earth Core Area 2013 Waterfloods Waterflood Initial response 3 to 4 months Full response 12 months Recovery over Primary 50% to 100% Production Increase 3 - 5x Legend Existing Waterflood Approved Waterflood Future Waterflood PRY…
Waterflood Performance to Date 450 200,000 600 120,000 Evi 1 Sec 16/17-87-11W5 Loon Sec 26/27-86-09W5 Oil Prod & Water Inj Rate (b/d) Cumulative Production (bbl) Oil Prod & Water Inj Rate (b/d) 400 180,000 Cumulative Production…
Why Invest in Pinecrest One of the largest positions in Slave Point light oil resource Large inventory of drilling opportunities with additional waterflood upside Large oil in place and high netbacks Experienced Board of Directors and…
 Loading...