Targa Resources Investor Presentation First Quarter 2013 May 3, 2013
Targa Resources Two Public Companies Targa Resources Partners LP Targa Resources Corp. (NYSE: NGLS) (NYSE: TRGP) IPO February 2007 IPO December 2010 MLP C-Corp Owner/Operator of all assets General Partner of NGLS Market Cap: 4.7…
Targa Corporate Structure Targa Resources Corp. 100% Indirect (NYSE: TRGP) Ownership (TRC or the Company)(1) 12.3% LP Interest (12,945,659 LP Units) Public Unitholders Targa Resources GP LLC 85.7% LP Interest 2.0% General…
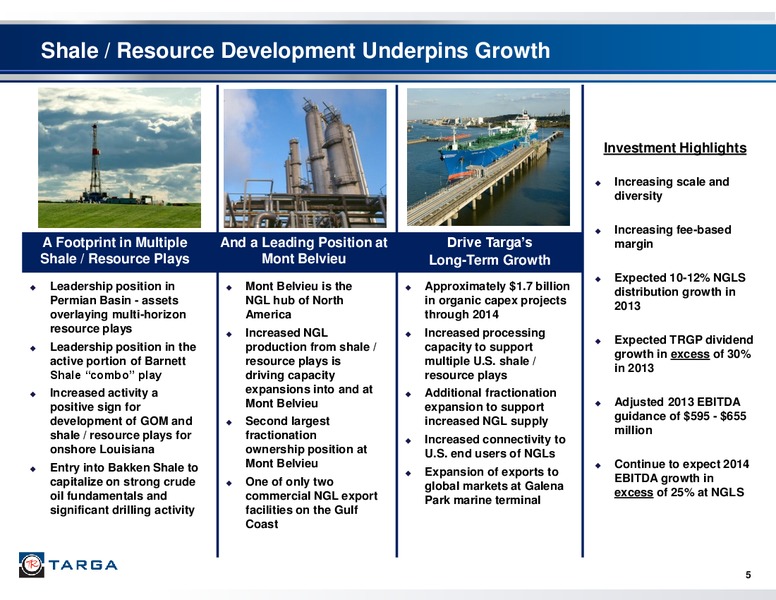
Shale / Resource Development Underpins Growth Investment Highlights Increasing scale and diversity Increasing fee-based A Footprint in Multiple And a Leading Position at Drive Targas margin Shale / Resource Plays Mont Belvieu…
Targas Expanding G&P Footprint Advances in E&P technology deployed in Badlands Acquisition Premier location in premier oil basin multiple shale / resource Premium, recently built assets plays across the U.S. 260k ac crude…
Producer Activity Drives NGL Flows to Mont Belvieu Increased NGL supplies flow to Mont Belvieu Most NGL pipelines into Mont Belvieu are close to 100% utilization with additional pipeline capacity coming on line in 2013 and 2014…
Major Capital Projects Announced Approximately 1.7 billion in announced projects expected to be completed in 2013 and 2014 Over 1.2 billion of projects planned in service in 2013 and 500 million in 2014 Additional high quality…
Margin is Largely Fee-Based / Hedged Fee-Based Margin is Increasing on Both an Absolute and Proportional Basis ( millions) 110.00 100% Fee-based operating 100.00 margin expected to 92 90.00 continue to increase to 80 75% 55%-65%+…
Distribution and Dividend Growth Expected NGLS 2013 distribution growth of NGLS Annualized Distribution Per LP Unit approximately 10% to 12% 3.00 2.79 Ability to continue increasing distribution as 2.72 Annualized Distributions…
Financial Profile Positions the Partnership for Growth Current capital structure and liquidity underpin NGLS Compliance Leverage Ratio access to capital 6.0x Target leverage ratio 3x - 4x Debt/EBITDA Actual leverage history at low…
TRP Capitalization and Liquidity ( in millions) Cash and Debt Maturity Coupon 12/31/2012 Adjustments 3/31/2013 Cash and Cash Equivalents 68.0 34.1 102.1 Accounts Receivable Securitization Jan-14 - 111.4 111.4 Senior Secured Debt…
Targa Investment Highlights Strong industry fundamentals High quality assets Well positioned in U.S. shale / resource plays Leadership position at Mont Belvieu Superior connectivity to markets Increasing scale and diversity…
Business Division and Segment Review 16
Targas Diversified Midstream Platform Badlands LTM as of 3/31/2013 Segment Operating Margin Marketing and Distribution 18% Field G&P 38% Logistics Assets 30% Coastal G&P 14% 17
Field Gathering and Processing Segment Field G&P Highlights 10 plants with 927 MMcf/d of gross processing capacity with expansions underway 30 MMcf/d expansion completed at SAOU during Q1 2013 Permian Basin activity dominated by…
Targas Permian Basin Systems and Broad Active Plays SAOU All oil wells with associated gas and NGLs Total 2012 well connects of 302 Higher number of horizontal well connects Versado 30 MMcf/d processing capacity expansion…
North Texas Well Positioned for Growth Most of assets located in liquids-rich portion of Barnett shale New Marble Falls play in Jack and Palo Pinto counties, leveraging existing system Recovered GPM of the system in the 4 5…
Targa Badlands Acquisition - Transaction Overview The Partnership acquired midstream assets in the Williston Basin in Q4 2012, renamed Badlands Bakken Shale projected to be among the fastest growing crude oil basins in the world…
Badlands - High-Quality, Fee-Based Assets System currently consists of oil gathering pipeline and terminal system and natural gas gathering and processing operations in McKenzie and Dunn counties, North Dakota Additional…
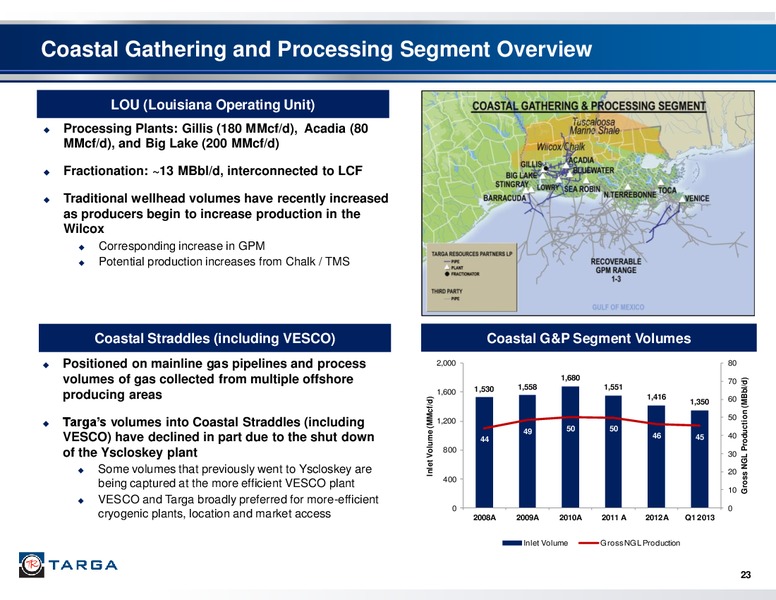
Coastal Gathering and Processing Segment Overview LOU (Louisiana Operating Unit) Processing Plants: Gillis (180 MMcf/d), Acadia (80 MMcf/d), and Big Lake (200 MMcf/d) Fractionation: 13 MBbl/d, interconnected to LCF Traditional…
Logistics Assets Logistics Assets Highlights Second largest owner and operator of fractionation capacity in Mont Belvieu and Louisiana Pipeline constraints into Mont Belvieu are alleviated as pipelines come online Targa Logistics…
Demand for Exports Continues to Increase U.S. Propane Increasing U.S. production and a favorable international price delta has led to increased 60 1.00 0.90 exports 50 0.80 0.70 40 0.60 Relatively large inventory compared…
Petroleum Logistics - Current Capabilities and Projects Announced 105 million of growth capital related to three terminals acquired in 2011 Completed 35 million expansion of Targa Sound in Q1 2013 to connect with a local products…
Marketing and Distribution Segment Marketing and Distribution Highlights NGL and Natural Gas Marketing Manage physical distribution of mixed NGLs and specification products using owned and third party facilities Manage inventories…
Appendix 28
Non-GAAP Measures Reconciliation Adjusted EBITDA The Partnership and Targa define Adjusted EBITDA as net income before: interest; income taxes; depreciation and amortization; gains or losses on debt repurchases and redemptions; early…
Non-GAAP Measures Reconciliation EBITDA and Gross Margin The following table presents a reconciliation of Adjusted EBITDA and operating margin to net income (loss) for the periods shown for TRP: Three Months Ended March 31, 2013…
Non-GAAP Measures Reconciliation - DCF The following table presents a reconciliation of reported distributable cash flow to net income (loss) for the periods shown for TRP: Three Months Ended ( in millions) 31-Mar 30-Jun 30-Sep…
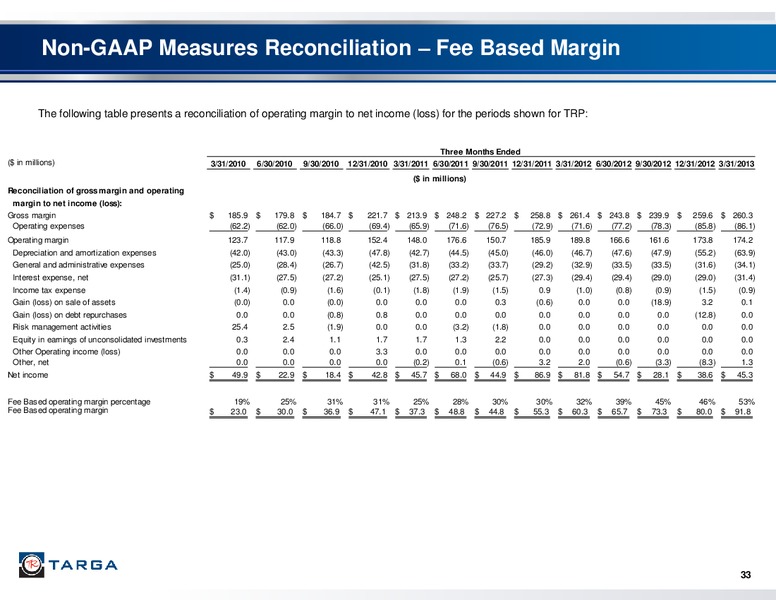
Non-GAAP Measures Reconciliation Fee Based Margin The following table presents a reconciliation of operating margin to net income (loss) for the periods shown for TRP: Three Months Ended ( in millions) 3/31/2010 6/30/2010 9/30/2010…
 Loading...