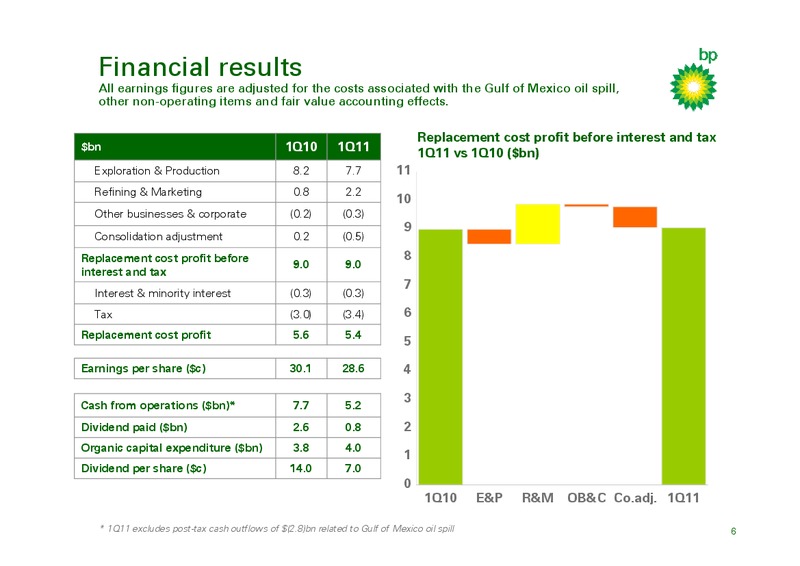
Financial results All earnings figures are adjusted for the costs associated with the Gulf of Mexico oil spill, other non-operating items and fair value accounting effects. Replacement cost profit before interest and tax bn 1Q10 1Q11…
Exploration & Production Replacement cost profit before interest and tax Adjusted for non-operating items and fair value accounting effects Average hydrocarbon realizations (/boe) 10 60 Stronger environment 8 50 Production…
Refining & Marketing Replacement cost profit before interest and tax Adjusted for non-operating items and fair value accounting effects 2.5 12.5 Improved refining margins Refining marker margin (/bbl) 2.0 10.0 Very strong…
Other businesses & corporate Replacement cost profit before interest and tax Adjusted for non-operating items and fair value accounting effects 0.2 Lower income following business restructuring 0 Guidance remains at 400 million…
Gulf of Mexico oil spill costs and provisions (pre-tax, pre-partner recovery) bn FY10 1Q11 Income statement Charge for the period 40.9 0.4 Balance sheet * 23.3 Brought forward Charge / (credit) to income statement 40.9 0.4…
Sources & uses of cash 1Q10 1Q11 10 9 Trust fund 8 Disposals Other Gulf of 2.6 billion of disposals completed Mexico oil during 1Q spill 7 Inorganic payments Capex Disposals 6 Additional 4.6 billion of cash Inorganic Capex*…
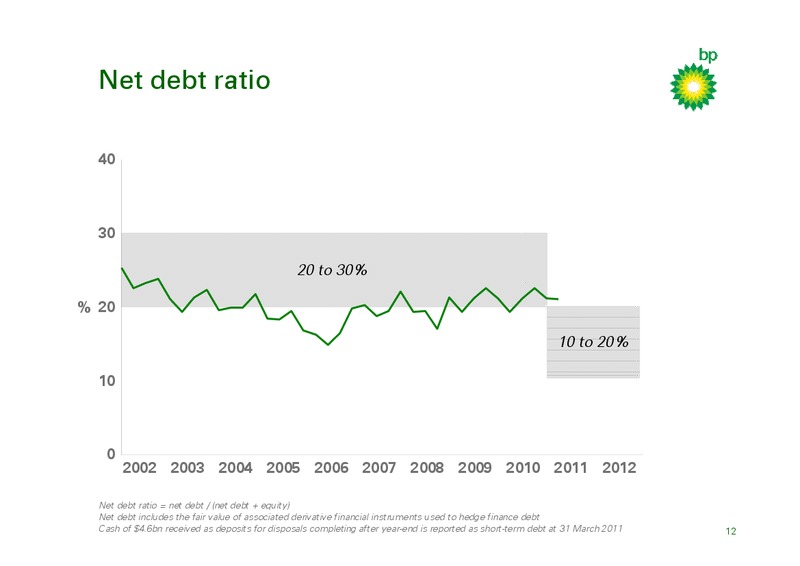
Net debt ratio 40 30 20 to 30% % 20 10 to 20% 10 0 2002 2003 2004 2005 2006 2007 2008 2009 2010 2011 2012 Net debt ratio = net debt / (net debt + equity) Net debt includes the fair value of associated derivative…
2011 acquisitions and disposals Acquisitions Acquisitions Disposals Disposals Announced in 1Q Completed in 1Q India Reliance Industries alliance Colombia Brazil CNAA ethanol Gulf of Mexico Devon assets Awaiting completion…
Strategic progress Putting Safety & Operational Risk management at the heart of the company Safety & Operational Risk organization in operation Upstream organization defined and key roles appointed Reward framework launched Re-building…
Q&A Byron Grote Chief Financial Officer Fergus MacLeod Head of Investor Relations 15
 Loading...