Hello and welcome everyone. This is BPs fourth-quarter and full-year 2013 Results webcast and conference call. Im Jessica Mitchell, BPs Head of Investor Relations. Im here with our Group Chief Executive Bob Dudley, and our Chief…
Thank you Jess and welcome everyone, wherever you are in the world. Thanks for joining us today. 4
Were here to look back at 2013. It was a busy year and also a successful one. We accomplished a number of important things. We improved our safety record. We had a very good year for exploration, in fact, our best in ten years. We…
sustainable growth in free cash flow in the years ahead. What you can see now is a company that has a more focused and stronger portfolio, leading positions in exploration, deepwater and giant fields, and a quality downstream business.…
So lets begin with an overview of our full-year 2013 results. Our underlying replacement cost profit was 13.4 billion. Post-tax operating cash flow was 21.1 billion. Our organic capital expenditure was 24.6 billion, in line with our…
To reinforce that point, let me give you another figure. Our reserves replacement ratio for 2013 was 129%, excluding the impact of acquisitions and divestments. If we include the net reserves growth as a result of the repositioning in…
Let me update you a little more on some important milestones. As many of you will recall, our 10-point plan consisted of things you could expect and things you could measure. And 2013 has set us up well to deliver. The first commitment…
discoveries in 2013 in Angola, Brazil, Egypt, the Gulf of Mexico and India. We also saw a series of high-value upstream projects come online. During 2013, three more projects started up, following the five we started up in 2012. These…
Thanks Bob. 8
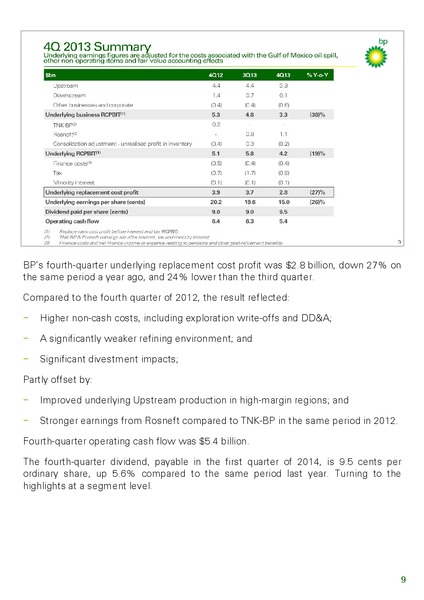
BPs fourth-quarter underlying replacement cost profit was 2.8 billion, down 27% on the same period a year ago, and 24% lower than the third quarter. Compared to the fourth quarter of 2012, the result reflected: Higher non-cash costs,…
The Upstream underlying fourth-quarter replacement cost profit before interest and tax of 3.9 billion compares with 4.4 billion a year ago and 4.4 billion in the third quarter of 2013. Compared to the fourth quarter of 2012 the result…
Higher costs, partly due to the exploration write-offs; Absence of the one-off benefit in the third-quarter related to the Trans-Alaska Pipeline System; and Lower liquids realisations; Partly offset by: Improved underlying…
Turning to Russia, this slide shows our share of earnings from Rosneft, and historically from TNK-BP. BPs underlying net income related to its Rosneft shareholding was 1.1 billion in the fourth quarter. This compares to BPs share of…
In the Downstream, the fourth-quarter underlying replacement cost profit before interest and tax was 70 million compared with 1.4 billion a year ago and 720 million in the third quarter. The result included a loss of 200 million in the…
excess supply in Asia and the United States, partly offset by lower turnaround activity. Looking forward to 2014, we expect refining margins to improve from the levels seen in the fourth quarter, but in general we expect the fuels and…
In Other Businesses and Corporate, the pre-tax underlying replacement cost charge was 610 million for the fourth quarter, an increase of 170 million on the same period a year ago. The fourth quarter result included certain one-off…
The charge for the Gulf of Mexico oil spill was 190 million in the fourth quarter, primarily reflecting an increase in the provision for legal costs plus the ongoing cost of running the Gulf Coast Restoration Organisation. This brings the…
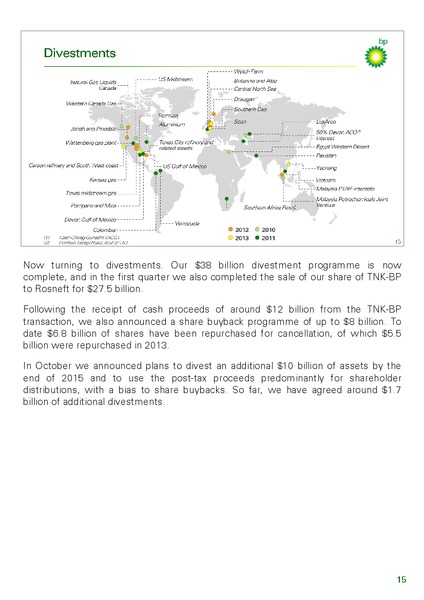
Now turning to divestments. Our 38 billion divestment programme is now complete, and in the first quarter we also completed the sale of our share of TNK-BP to Rosneft for 27.5 billion. Following the receipt of cash proceeds of around 12…
Now looking at our full-year cash flow movements, this slide compares our sources and uses of cash in 2012 and 2013. Operating cash flow for 2013 was 21.1 billion which includes 1.4 billion of pre-tax expenditure related to the Gulf of…
Net debt at year-end was 25.2 billion with gearing of 16.2% compared to 18.7% a year ago. Our intention remains to keep gearing in a target band of 10% to 20% whilst uncertainties remain. 17
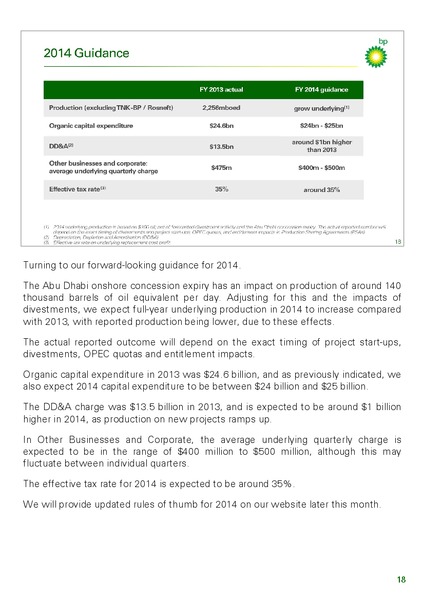
Turning to our forward-looking guidance for 2014. The Abu Dhabi onshore concession expiry has an impact on production of around 140 thousand barrels of oil equivalent per day. Adjusting for this and the impacts of divestments, we expect…
Before I hand you back to Bob Id like to summarise our overall financial framework. We expect the combination of continued operating cash flow growth and capital discipline to enable us to grow sustainable free cash flow, underpinning…
Thank you Brian. 20
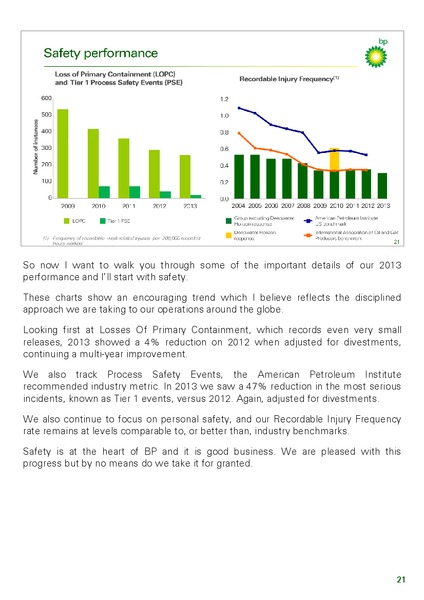
So now I want to walk you through some of the important details of our 2013 performance and Ill start with safety. These charts show an encouraging trend which I believe reflects the disciplined approach we are taking to our operations…
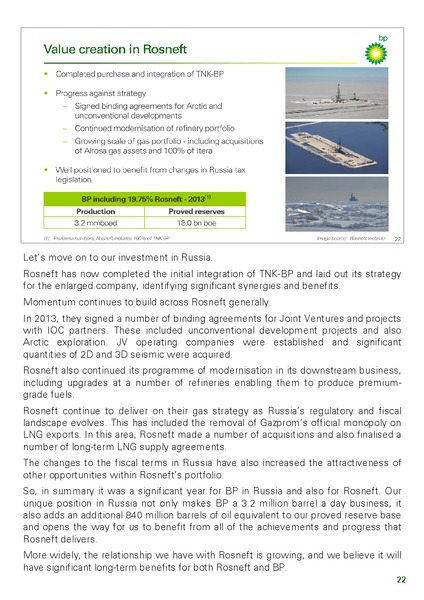
Lets move on to our investment in Russia. Rosneft has now completed the initial integration of TNK-BP and laid out its strategy for the enlarged company, identifying significant synergies and benefits. Momentum continues to build across…
Now let me give you an update on the status of certain Gulf of Mexico related legal proceedings in the United States. The first phase of the MDL 2179 trial in New Orleans focused on the causes of the accident and the allocation of fault…
appealed to the same panel requesting a permanent injunction to prevent such improper awards. This panel has agreed to consider these causation issues on an expedited basis. In the meantime, a temporary injunction remains in place for all…
Moving on, let me update you on what we have done in our Upstream. 24
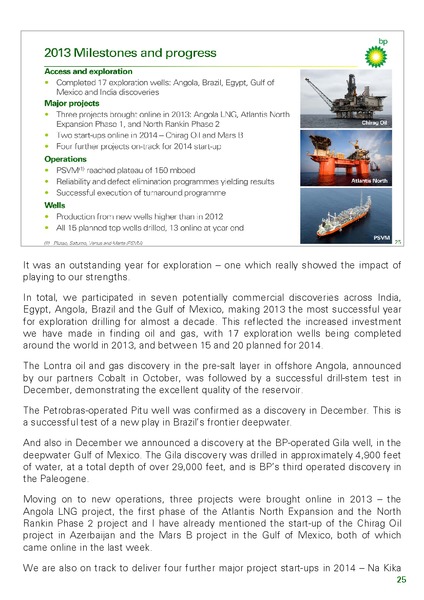
It was an outstanding year for exploration one which really showed the impact of playing to our strengths. In total, we participated in seven potentially commercial discoveries across India, Egypt, Angola, Brazil and the Gulf of Mexico,…
Phase 3 in the Gulf of Mexico, Kinnoull in the North Sea, CLOV in Angola, and Sunrise Phase 1 in Canada. Across the portfolio, we continue to maintain our focus on the safe, reliable execution of activities. In 2013 we achieved a…
Now let me update you in more detail on our major projects. Our recent key start-ups continue to ramp-up their production. For example PSVM in Angola, which started at the end of 2012, reached plateau production of 150,000 barrels of oil…
2011. Looking to our next wave of developments, we sanctioned two significant projects in the fourth quarter of 2013, which we expect to deliver value for BP for decades to come: Shah Deniz Stage 2 and its associated Southern Corridor…
Now turning to the Downstream. 27
In 2013 there were continuing improvements in safety and reliability, as well as delivering several significant milestones. The number of Tier One safety events decreased and the business achieved a steady decrease in losses of primary…
addition to Zhuhai, we are also retrofitting our existing facilities with our latest PTA technology to improve cost efficiency. We also announced two new breakthrough petrochemical technologies in 2013, SaaBre and Hummingbird, which we…
So I would like to close by summarising what we have achieved and look to 2014 and beyond. 29
We have talked today about the milestones passed in 2013. These and other recent achievements form the foundations for delivering value into the long term. Our aim is to grow sustainable free cash flow as we continue to build and operate…
 Loading...