MEG Highlights 100% ownership of over 800 square miles of oil sands leases World-Scale Oil Resource Steam assisted gravity drainage (SAGD) technology Opportunity 1.9 billion bbls of 2P and 3.7 billion bbls of contingent resources…
Steam Assisted Gravity Drainage (SAGD) MEG utilizes SAGD, a form of in situ SAGD Process technology MEG only uses 80% of Albertas oil sands are SAGD in situ accessible with in situ production methods In situ provides: 1. Scalability…
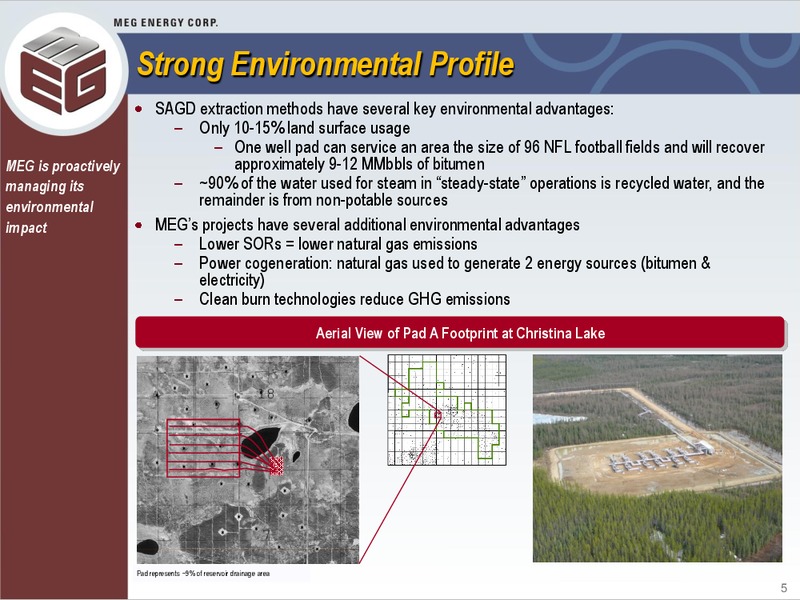
Strong Environmental Profile SAGD extraction methods have several key environmental advantages: Only 10-15% land surface usage One well pad can service an area the size of 96 NFL football fields and will recover MEG is proactively…
Asset Overview Evaluated by GLJ (December 31, 20100 ) 10 miles Not Yet Evaluated MEG assets are in HWY 63 ConocoPhillips Surmont well-defined, MEG proven SAGD MEG Growth Properties Surmont producing areas Thornbury HWY 881 MEG…
Resource Base Has Grown Significantly As at 12/31/10, PV-10% of 2P reserves was 12.1 bn and 13.3 bn of contingent resources (best estimate) MEG has 2P Reserves Contingent Resources demonstrated a strong track (mmbbls) record of reserve…
Production Ramp-Up 30000 Production has Budget ramped up ahead of budget 25000 Actual 20000 Bitumen Rate bbls/d 15000 10000 5000 Scheduled Plant Turnaround 0 1-Aug-09 1-Nov-09 1-Feb-10 4-May-10 1-May-10…
Current SOR Performance 10 MEG has achieved 9 lower than budgeted SORs to- Budget date and expects 8 Steam-Oil-Ratio (including Circulation Wells) Actual similar results to comparable 7 projects in the region 6 5 4 3…
Project Development Summary Preliminary Project Development Schedule(1) MEG believes a 2010 2011 2012 2013 2014 2015 2016 2017 2018 2019 2020 staged Christina Lake development plan will help to Phase 2B mitigate capital, (2)…
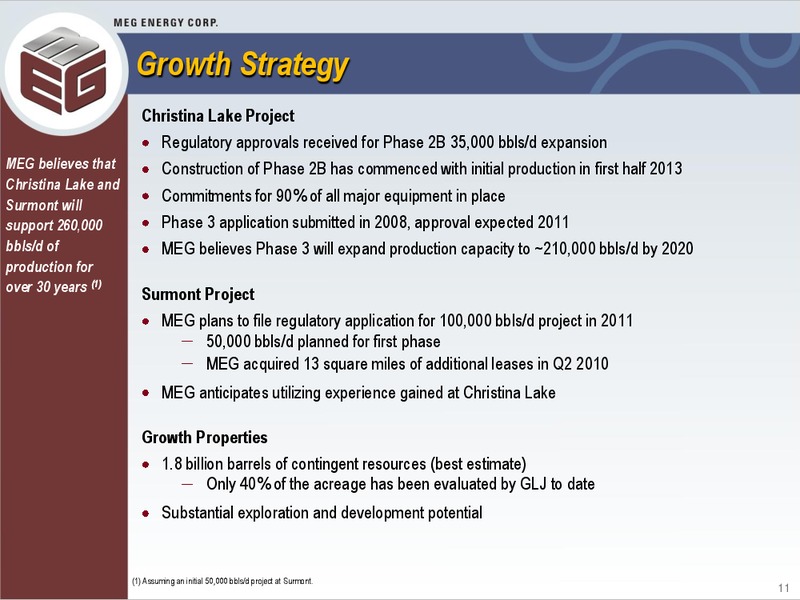
Growth Strategy Christina Lake Project Regulatory approvals received for Phase 2B 35,000 bbls/d expansion MEG believes that Construction of Phase 2B has commenced with initial production in first half 2013 Christina Lake and Surmont…
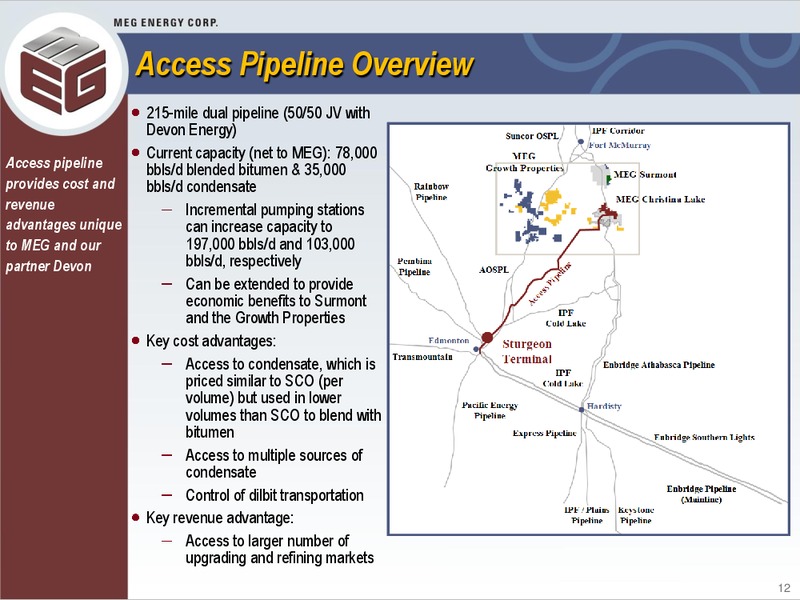
Access Pipeline Overview 215-mile dual pipeline (50/50 JV with Devon Energy) Current capacity (net to MEG): 78,000 Access pipeline bbls/d blended bitumen & 35,000 provides cost and bbls/d condensate revenue Incremental pumping…
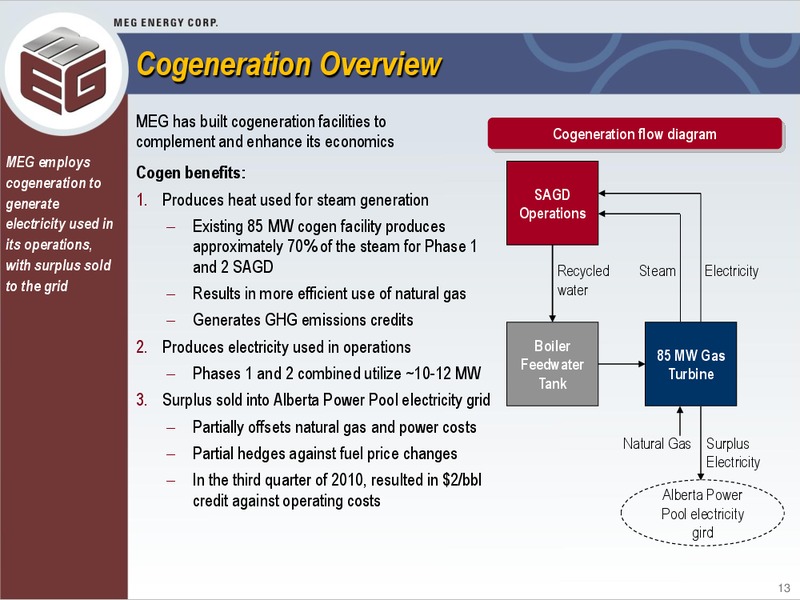
Cogeneration Overview MEG has built cogeneration facilities to complement and enhance its economics Cogeneration flow diagram MEG employs Cogen benefits: cogeneration to 1. Produces heat used for steam generation SAGD generate…
2011 Capital Investment Budget Total Capital Investment for 2011 900 MM Expand and further define resource base - Core hole drilling 80-90 MM Staged production growth - Christina Lake Phase 2B expansion 450 MM - Infrastructure: 200…
MEGs Christina Lake Project 15
APPENDICES 16
Appendix 1 - Christina Lake Delineation Wells (2010) 10 miles 80 sections MEG Oil Sands Leases 527 vertical wells 454 wells cored Phase 2 Area Phase 2 Phase 1 Wabiskaw / McMurray Cores CVE Christina Lake 17
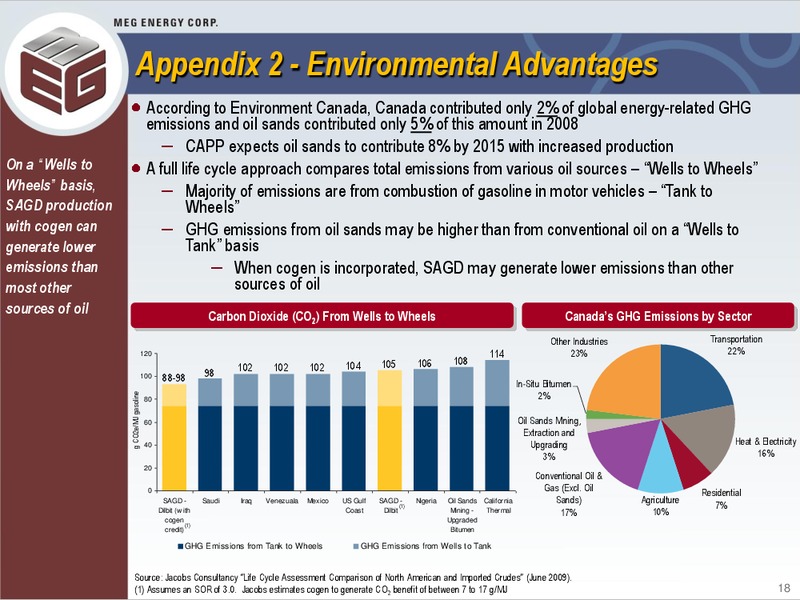
Appendix 2 - Environmental Advantages According to Environment Canada, Canada contributed only 2% of global energy-related GHG emissions and oil sands contributed only 5% of this amount in 2008 CAPP expects oil sands to contribute 8%…
 Loading...