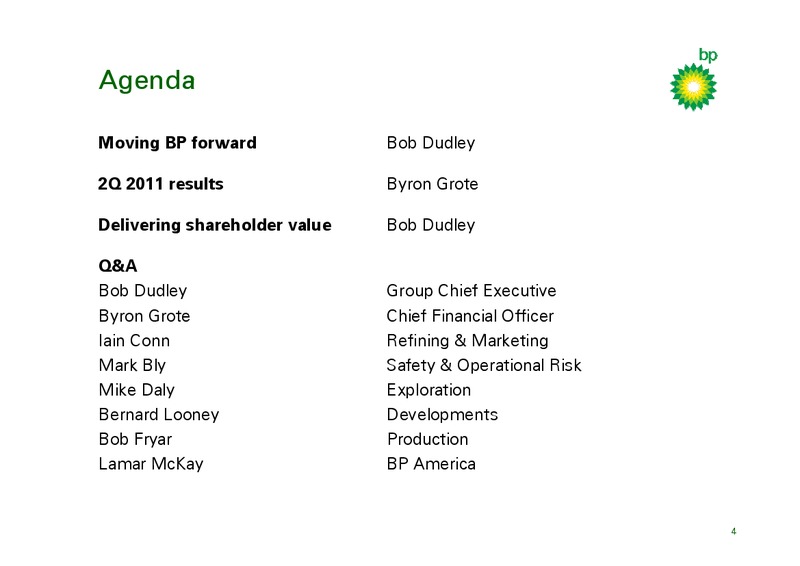
Agenda Moving BP forward Bob Dudley 2Q 2011 results Byron Grote Delivering shareholder value Bob Dudley Q&A Bob Dudley Group Chief Executive Byron Grote Chief Financial Officer Iain Conn Refining & Marketing Mark Bly Safety &…
Moving BP forward Rebuilding value Putting safety & operational risk management at the heart of the company New Safety & Operational Risk function Long-term integrated approach Aligning incentives: rebasing performance management and…
Moving BP Forward Strategic progress 1H 2011 Putting safety & operational risk management at the heart of the company New Safety & Operational Risk organization in place: stronger checks and balances Increased investment in integrity…
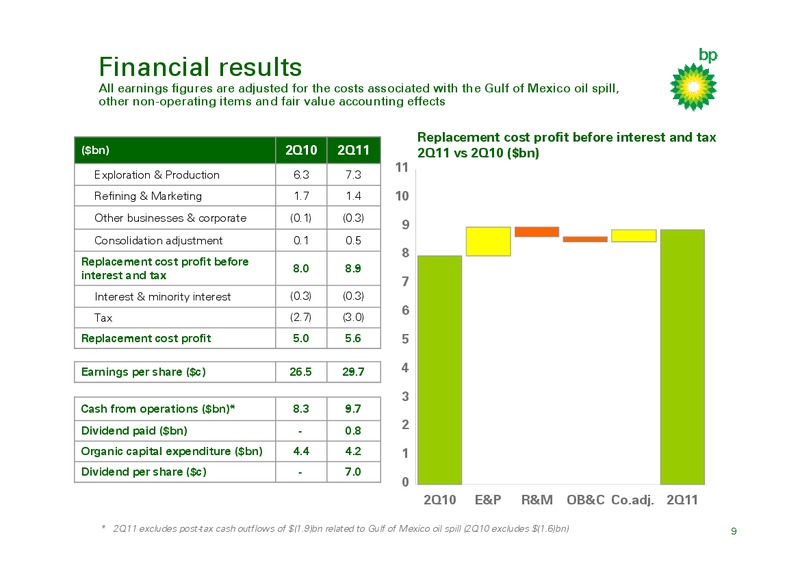
Financial results All earnings figures are adjusted for the costs associated with the Gulf of Mexico oil spill, other non-operating items and fair value accounting effects Replacement cost profit before interest and tax (bn) 2Q10…
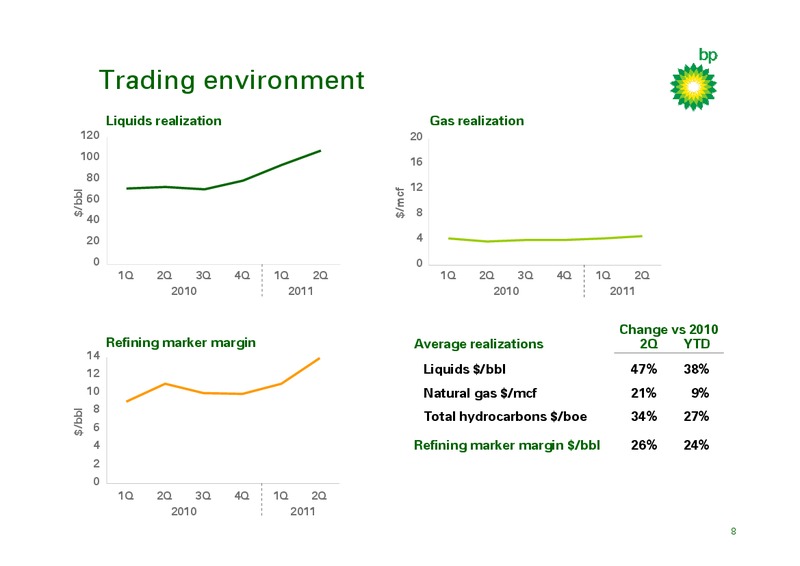
Exploration & Production Replacement cost profit before interest and tax Adjusted for non-operating items and fair value accounting effects Stronger environment 10 Production 11% lower 80 Average hydrocarbon realizations…
Refining & Marketing Replacement cost profit before interest and tax Adjusted for non-operating items and fair value accounting effects Improved refining environment 2.5 15.0 Weak supply and trading contribution Refining marker…
Other businesses & corporate Replacement cost profit before interest and tax Adjusted for non-operating items and fair value accounting effects Higher group level functional spend as a consequence of the Gulf of 0.2 Mexico oil…
Gulf of Mexico oil spill costs and provisions (pre-tax*) bn FY10 1Q11 2Q11 Income statement Charge/ (credit) for the period 40.9 0.4 (0.6) Balance sheet** Brought forward 23.3 20.6 Charge/ (credit) to income statement 40.9 0.4…
Sources & uses of cash 1H10 1H11 1.6 billion of disposals 24 completed during 2Q 22 (4.2 billion in 1H11) 20 Trust fund Other GoM Additional 4.6 billion of cash 18 Disposals oil spill deposits held at the end of the Disposals…
Net debt ratio 35 30 25 20 to 30% 20 % 10 to 20% 15 10 5 0 2008 2009 2010 2011 2012 Net debt ratio = net debt / (net debt + equity) Net debt includes the fair value of associated derivative financial instruments used…
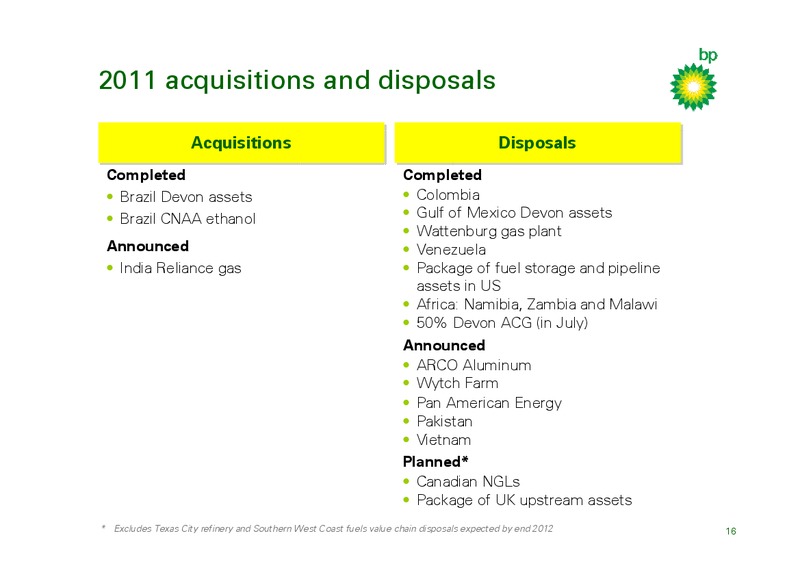
2011 acquisitions and disposals Acquisitions Acquisitions Disposals Disposals Completed Completed Brazil Devon assets Colombia Brazil CNAA ethanol Gulf of Mexico Devon assets Wattenburg gas plant Announced Venezuela India…
Bob Dudley Group Chief Executive 17
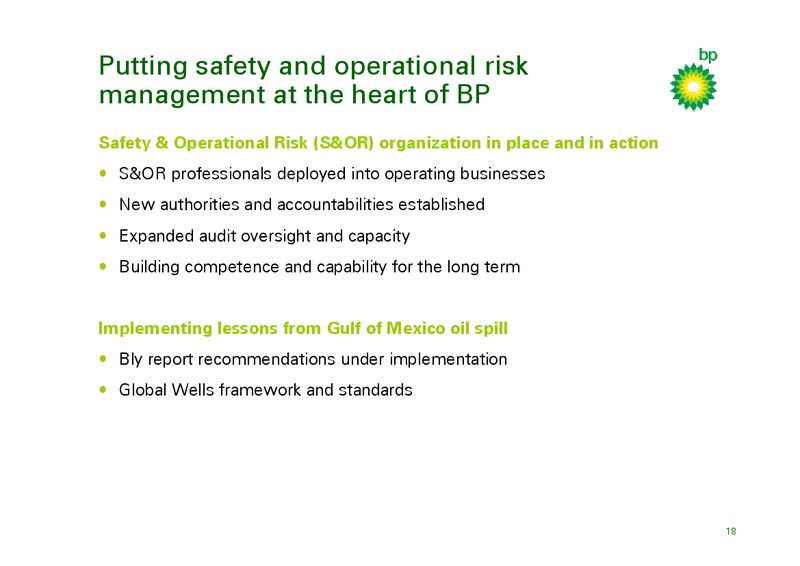
Putting safety and operational risk management at the heart of BP Safety & Operational Risk (S&OR) organization in place and in action S&OR professionals deployed into operating businesses New authorities and accountabilities…
Rebuilding trust Meeting our commitments in the US Completing the response Majority of shoreline clean-up complete Gulf Coast showing promising signs of recovery Strong signs of improvement for tourism and seafood during 1H 2011 All…
Gulf of Mexico liabilities: timeline and milestones Indicated dates* Key investigations Presidential Commission final report 11 January 2011 US Coast Guard preliminary report 22 April 2011 Marine Board investigation final report To be…
Upstream value growth Risk reduction Active portfolio management Growing operating cash faster than production Increased investment with a focus on exploration Growth engines Deepwater Gas value chains Giant fields 21
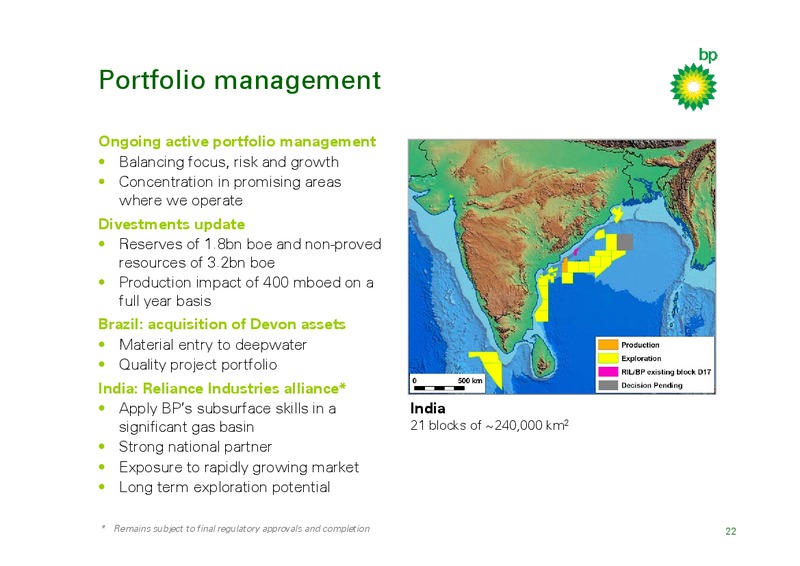
Portfolio management Ongoing active portfolio management Balancing focus, risk and growth Concentration in promising areas where we operate Divestments update Reserves of 1.8bn boe and non-proved resources of 3.2bn boe Production…
Operating cash growth Potential to grow operating cash flow Unit operating cash margin growth Production growth Near term milestones Greater Plutonio now online following turnaround Re-starting drilling operations in the Gulf of…
Growth 20122013 Angola Gulf of Mexico North Sea 2012/2013 Major Project start-ups BP working Location Project Type interest % Gross capacity Angola Angola LNG z 14 5 mtpa Block 31 PSVM* z 27 150 mboed Clochas-Mavacola z 27 100…
Increased investment for growth Up to 1 mmboed of production by end 2016 from new projects Increasing organic capital reinvestment for longer-term growth Half of capital over the next five years focused on growth post 2016…
Increased focus on exploration Plans to double exploration spend on track 2006-11 exploration portfolio rebuild creates potential to double drilling investment Adding new acreage in established areas: Gulf of Mexico, Egypt,…
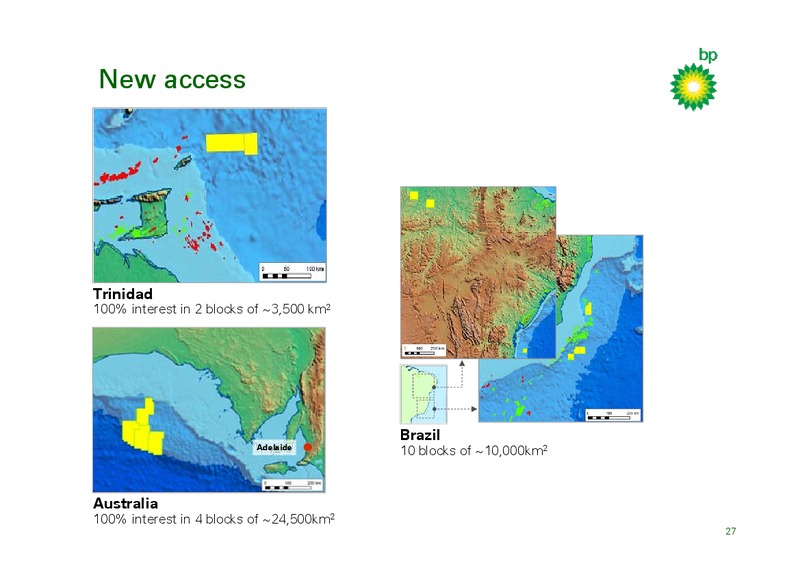
New access Trinidad 100% interest in 2 blocks of 3,500 km2 Brazil Adelaide 10 blocks of 10,000km2 Australia 100% interest in 4 blocks of 24,500km2 27
Future growth engines Global deepwater Managing complexity Differentiated technology Gas value chains Relationships Global project management Integrating value across long chains Giant fields and resource plays Huge resource…
Refining & Marketing value growth Safety and trust Safe and reliable operations remain the number one priority Focus on process safety risk management and Operating Management System Earnings momentum On track to deliver in excess of…
Whiting Refinery Modernization Project Sources of value Historical light / heavy crude Margin capture capability differential 600 45 Indexed pre tax underlying RC profit 40 500 Mid West post project performance for a range of…
Moving BP Forward Year of consolidation Building momentum 2011 2012 2013+ New S&OR organisation Planned divestment of Texas Whiting on-stream 2013 Investing in integrity/increased City refinery/Southern West 9 major upstream…
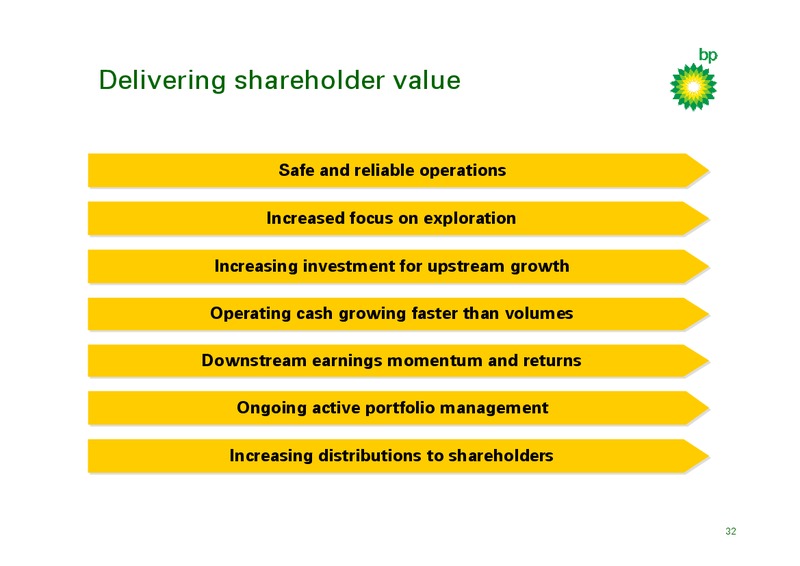
Delivering shareholder value Safe Safe and and reliable reliable operations operations Increased Increased focus focus on on exploration exploration Increasing Increasing investment investment for for upstream upstream…
Q&A Mike Daly Bob Dudley Executive Vice President, Group Chief Executive Exploration Bernard Looney Byron Grote Executive Vice President, Chief Financial Officer Developments Iain Conn Bob Fryar Chief Executive Executive…
 Loading...