Agenda 9:30 a.m. Welcome John Charlton, Manager, Investor Relations Energy Outlook Rich Kruger, Chairman, President and CEO Corporate Overview Downstream & Chemical Paul Masschelin, Senior Vice-President, Finance BREAK (10…
Cautionary statement This presentation contains forward-looking information on future production, project start-ups and future capital spending. Actual results could differ materially due to changes in project schedules, operating…
Energy Outlook
Economic growth drives energy demand Global energy demand up 35% by 2040 GDP Energy Demand trillions 2005 Quadrillion BTUs Non OECD OECD Source: ExxonMobil 2013 Outlook for Energy 5
Demand for all energy sources to increase Oil and gas will continue to meet 60% of total demand World energy demand by source Quadrillion BTUs 250 2040 200 2010 150 100 50 0 Oil Gas Coal Nuclear Other Source:…
Significant new liquids supplies required 65+ million barrels per day of new production required by 2035 Global liquids mb/d 120 100 80 New 60 production required Existing 40 production 20 0 2010 2035 Source:…
Canadian oil sands growth to continue With projected growth, North America balanced post-2030 North American liquids mbd Canadian Oil Sands Biofuels NGLs, Other Crude & Condensate Source: ExxonMobil 2013 Outlook for…
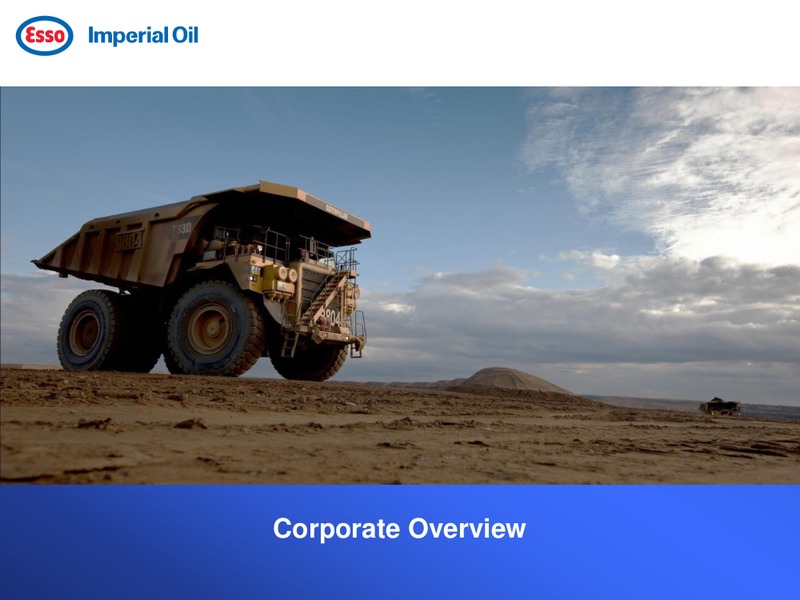
Corporate Overview
Imperial Oils business model Deliver superior, long-term shareholder value 1. Long-life, advantaged assets 2. Disciplined investment and cost management 3. Integration and synergies 4. High-impact technologies and innovation…
Operational excellence & risk management Comprehensive system to manage operational risks Operations Integrity Management System 11
Workforce safety Safety is first in all we do Workforce safety Incidents per 200k hours 0.8 0.6 0.4 Best ever 0.2 0.0 2008 2009 2010 2011 2012 12
Spills & other releases Committed to ensuring the integrity of our operations Spills and other releases Number 50 Protect 40 Tomorrow. Today 30 Best ever 20 10 0 2008 2009 2010 2011 2012 13
Air emissions Committed to reducing the environmental impact of our operations Emissions k tonnes/year 80 60 Best ever 40 20 0 2008 2009 2010 2011 2012 14
Financial performance Record earnings per share in 2012 Net income per share /share 5 2012 1Q13 4 Earnings - billions 3.77 0.80 Earnings - per share1 4.42 0.94 3 ROCE - % 23 20 Gross production2 - koebd 282 284 2…
Industry leadership across all business lines Worlds largest in-situ heavy oil operation at Cold Lake Worlds largest oil sands producer at Syncrude Next generation mining project at Kearl Largest petroleum refiner in Canada…
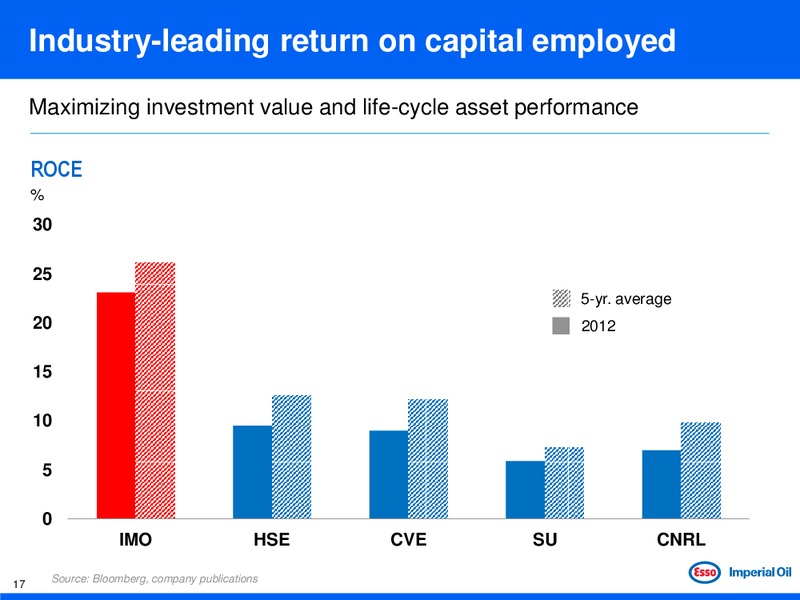
Industry-leading return on capital employed Maximizing investment value and life-cycle asset performance ROCE % 30 25 5-yr. average 20 2012 15 10 5 0 IMO HSE CVE SU CNRL Source: Bloomberg, company publications 17
Unmatched shareholder distributions Nearly 14 billion returned to shareholders in last 10 years Shareholder distributions 2003-2012 billions 15 Share reductions 10 Dividends 5 0 IMO HSE SU CNRL CVE Source: company…
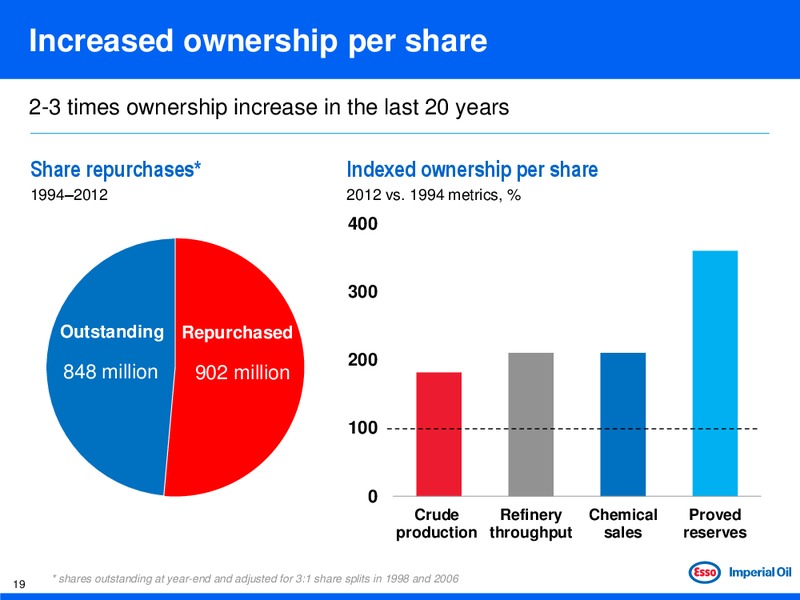
Increased ownership per share 2-3 times ownership increase in the last 20 years Share repurchases* Indexed ownership per share 19942012 2012 vs. 1994 metrics, % 400 300 Outstanding Repurchased 200 848 million 902 million…
Large, non-proved resource base 13 billion oil-equivalent barrels to support profitable growth 2012 resource base billion oeb* 15 Other Gas 10 Growth Mining opportunities 5 Liquids In-situ Progressing 0 1 2 3 *…
Executing plans to achieve growth Investing about 40 billion this decade focused on upstream growth Average capex per year* billions 5 4 3 2 1 0 2000-2009 2010-2019 *Upstream, Downstream, Chemical & Corporate 22
Production positioned to double by 2020 Funded nearly 200 kbd of additional liquids Production outlook* kboed 600 New Opportunities To be Oil Sands - mining sanctioned Oil Sands - in-situ Under 400 Conventional construction…
Financial strength to support growth plans Strong balance sheet maintained under wide range of scenarios Debt to capital* % 50% S&P AAA rating 40% 55/bbl WTI Flexibility for new opportunities 30% 95/bbl WTI 20% 10%…
Downstream & Chemical
Integration & synergies Delivering competitive advantage across the value chain Production Refining Chemical Crude and Petroleum products Commodities natural gas and specialties Leveraging ExxonMobil relationship 26
Downstream & Chemical strategies Maximizing value of every molecule Consistently deliver best-in-class performance Provide valued and high-quality products and services Lead industry in efficiency and effectiveness…
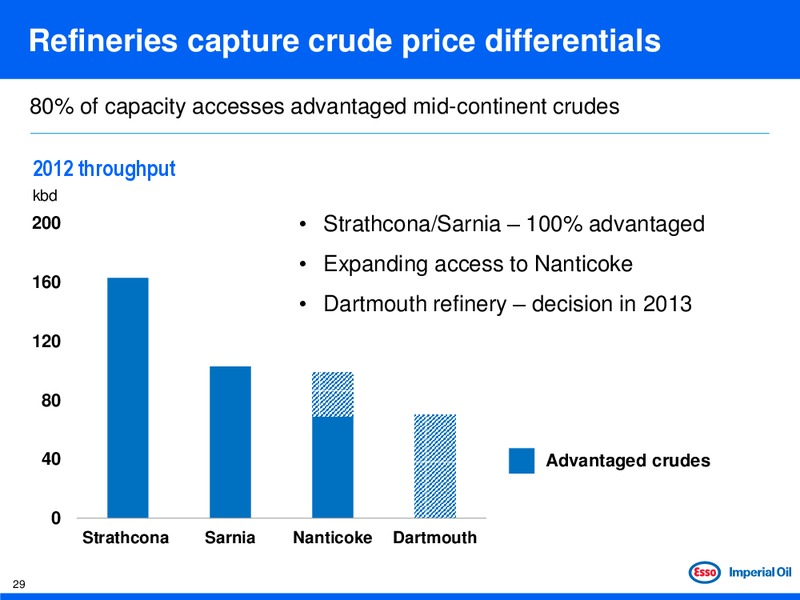
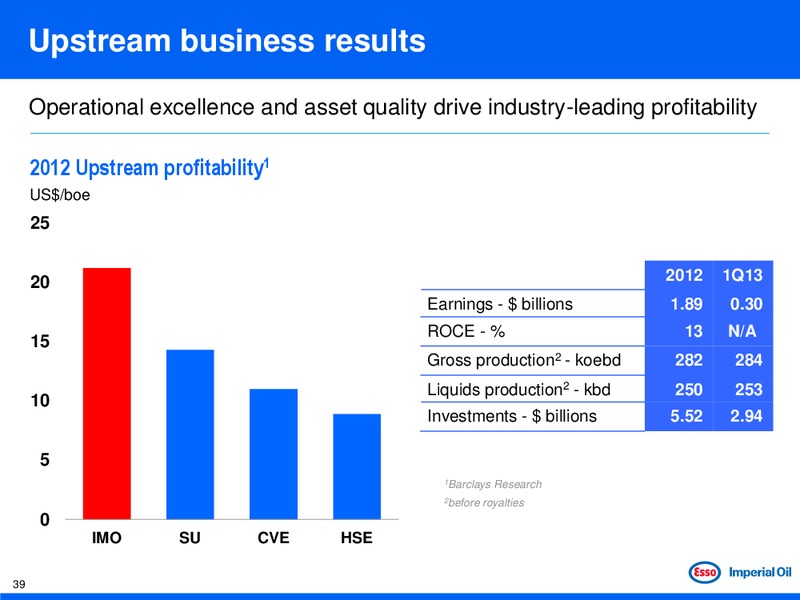
Downstream business results Record earnings and strong competitive position 2012 Downstream profitability* US/bbl 15 2012 1Q13 Earnings - billions 1.77 0.48 ROCE - % 63 N/A 10 Refinery throughput - kbd 435 430 Net petroleum…
Efficient operations and selective investment Relentless focus on operational excellence, costs and self-help Refining energy intensity Downstream & Chemical capex % % of depreciation 105 200 Industry 150 100 100 95…
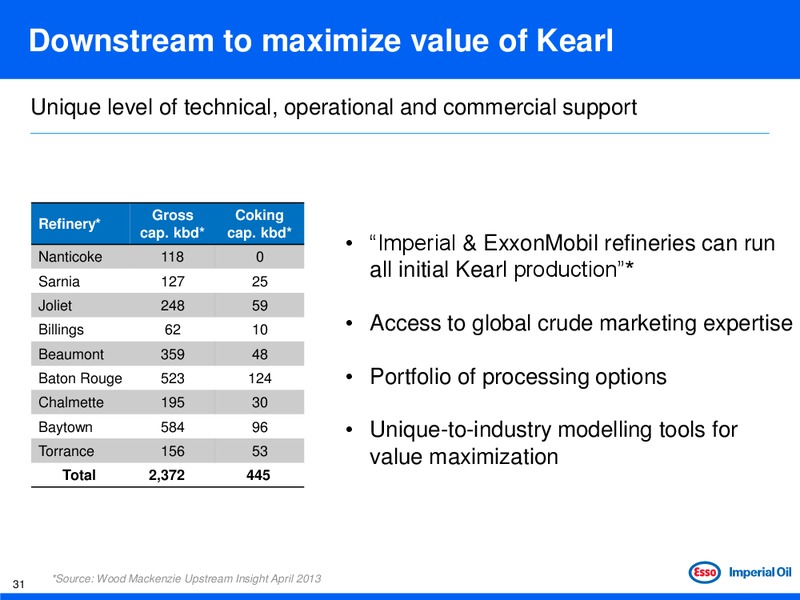
Downstream to maximize value of Kearl Unique level of technical, operational and commercial support Gross Coking Refinery* cap. kbd* cap. kbd* Imperial & ExxonMobil refineries can run Nanticoke 118 0 Sarnia 127 25 all initial…
Downstream value extends beyond refining World-class brands, extensive marketing networks Reliable provider of quality products National retail network 18% market share Diverse sales channels Company-owned retail sites in major…
Chemical business results Record earnings from integrated manufacturing 2012 1Q13 Earnings - millions 165 35 ROCE (%) 63 N/A Petrochemical sales (kT) 1,044 240 33
Focus on high-value products Sarnia polyethylene is a top-tier asset serving specialty customers Site advantages: Integrated with refinery Cracking ethane and propane Leading supplier to North American rotational moulding…
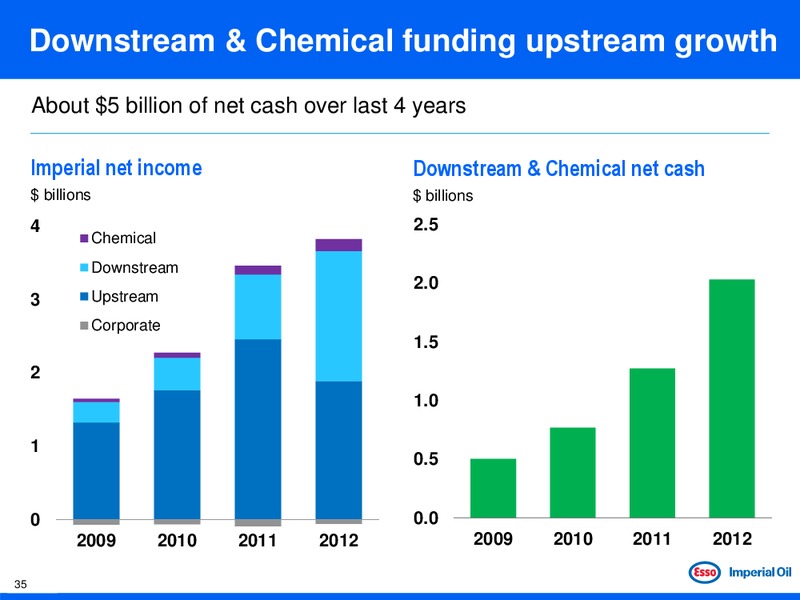
Downstream & Chemical funding upstream growth About 5 billion of net cash over last 4 years Imperial net income Downstream & Chemical net cash billions billions 4 2.5 Chemical Downstream 2.0 3 Upstream Corporate 1.5 2 1.0…
Upstream
World-class assets A distinct competitive advantage Cold Lake Syncrude Kearl 37
Upstream strategies Profitable growth, high-impact technology and portfolio quality Maximize value of existing production Invest in growth projects that deliver superior results Enhance resource value through high-impact…
Focused on increasing production First priority is to improve reliability Syncrude production kbd, 25% IOL share 100 Near-term opportunity range 75 50 25 0 2010 2011 2012 41
Systematic approach to reliability improvements Progress in several areas Downtime factors % 100 Extended average coker run life from 2 to 3 years 75 Addressed furnace failures by correcting erosion root cause 50 Addressed…
Focus on improving cost structure Progress in several areas Syncrude employee workforce number Aligned organization with IOL/EM 6000 best practices Line of sight through asset teams Eliminated redundant interfaces 5500 Sharing…
Cold Lake A premier asset Ownership: 100% Imperial Commercial start-up: 1985 Gross production: 150 kbd Active wells: 4,500 Cumulative production: 1 billion bbls Proved reserves: 1.1 billion bbls* Non-proved resource:…
Industry-leading reliability Consistently delivering nameplate capacity Production 3 year average 2010-2012* % of capacity IMO Cold Lake MEG Christina Lake CVE Foster Creek SU MacKay River DVN Jackfish CVE Christina Lake CNQ…
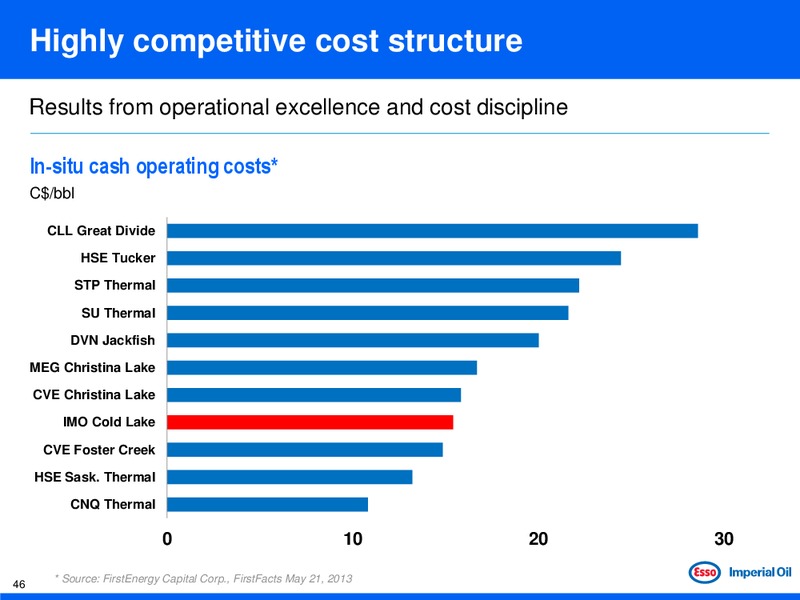
Highly competitive cost structure Results from operational excellence and cost discipline In-situ cash operating costs* C/bbl CLL Great Divide HSE Tucker STP Thermal SU Thermal DVN Jackfish MEG Christina Lake CVE…
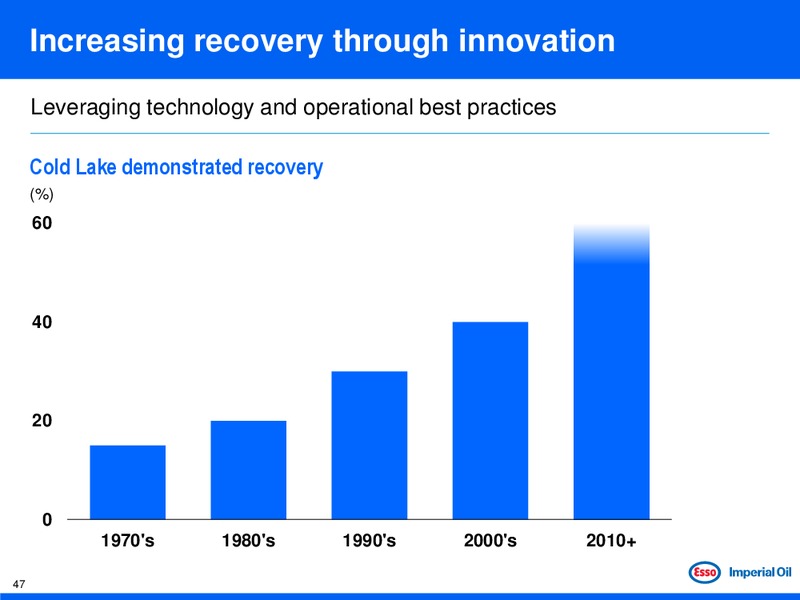
Increasing recovery through innovation Leveraging technology and operational best practices Cold Lake demonstrated recovery (%) 60 40 20 0 1970's 1980's 1990's 2000's 2010+ 47
Phased expansion design one, build many Over 1 billion barrels produced with continued growth planned Cold Lake production* kbd 200 Nabiye Mahkeses 150 Mahihkan Maskwa 100 Pilots 50 0 1980 1990 2000 2010 2012…
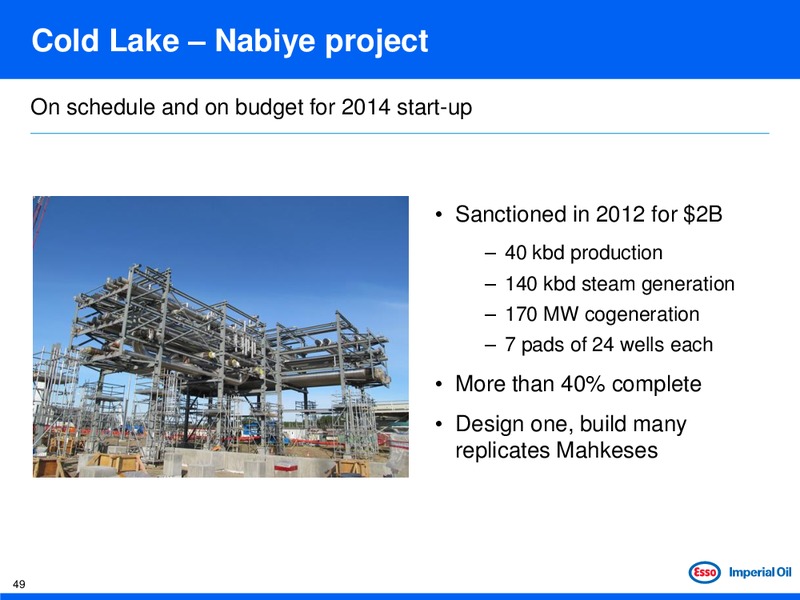
Cold Lake Nabiye project On schedule and on budget for 2014 start-up Sanctioned in 2012 for 2B 40 kbd production 140 kbd steam generation 170 MW cogeneration 7 pads of 24 wells each More than 40% complete Design one, build…
Kearl Next generation oil sands development Ownership: 71% Imperial 29% ExxonMobil Commercial start-up: 2013 Gross production: 110 kbd (initial)* 345 kbd (final)* Development cost: 6.80/bbl Recoverable resource: 4.6…
First oil sands mine without an upgrader Producing pipeline-quality diluted bitumen Mining Ore Preparation Plant Hydrotransport Proprietary Froth Treatment Extraction River Water Intake External Tailings Area 51
52
The Kearl value advantage Large resource, long-life production Resource quality Proprietary froth treatment Reliability enhancements Environmental performance Competitive cost structure 53
40+ year asset life Gross production plateau of 345 kbd, Imperial share 71% Kearl development plan* kbd 400 Plant Debottleneck 45 kbd 300 Third Ore Preparation Plant 80 kbd 200 Sanctioned Expansion Project 110 kbd…
Proprietary froth treatment Higher reliability, pipeline-quality and refinery-ready crude Sale Existing 3.5% Sediment and water Naphthenic mines Froth 96.5% Bitumen Synthetic crude Treatment Onsite Refinery upgrader…
Reliability enhancements Investment to reduce unit operating cost Dual slurry Oversized surge bin Dual hydro transport prep plants lines to main plant site Oversized crusher Dual surge bin feed conveyors 57
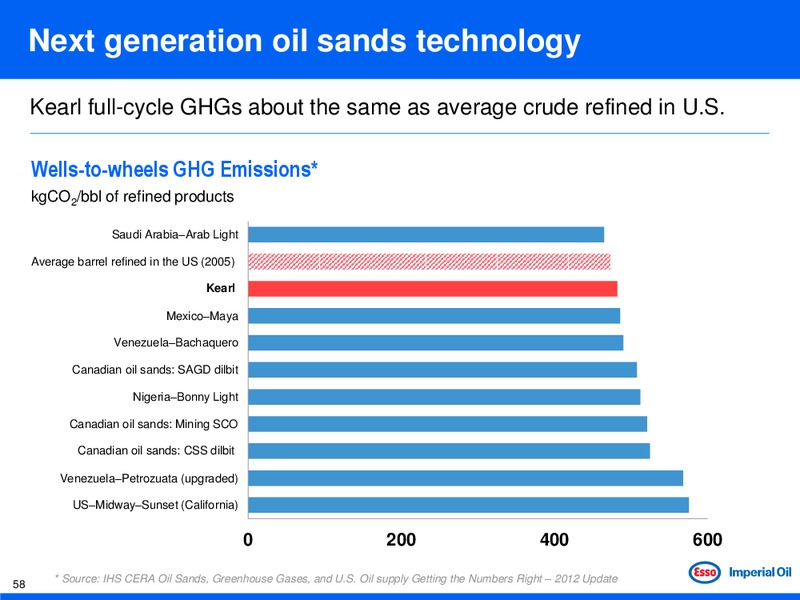
Next generation oil sands technology Kearl full-cycle GHGs about the same as average crude refined in U.S. Wells-to-wheels GHG Emissions* kgCO2/bbl of refined products Saudi ArabiaArab Light Average barrel refined in the US…
Cost structure competitive with SAGD Profitable across a broad range of oil prices Cost structure* /bbl Major opportunity for ongoing efficiencies 40 Application of IOL/EM best practices consistently delivers low unit costs…
Kearl Expansion Project On schedule and on budget for start-up late 2015 Sanctioned in 2011 for 8.9B Initial production 110 kbd About one-third complete All full-size modules being constructed in Edmonton Same contractors…
Upstream summary Significant near-term production and earnings growth Highly competitive operating costs Kearl and Nabiye designed for best-in-industry reliability Driving systematic improvements at Syncrude 300 kbd new…
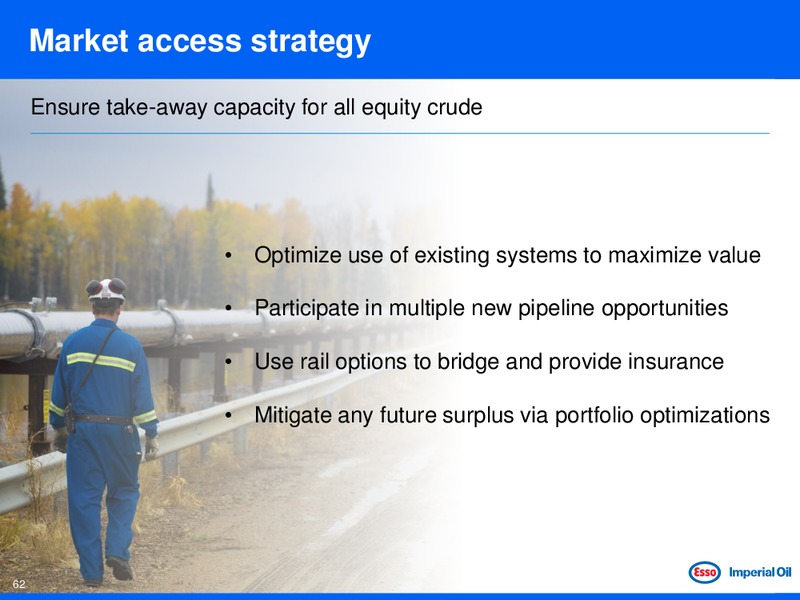
Market access strategy Ensure take-away capacity for all equity crude Optimize use of existing systems to maximize value Participate in multiple new pipeline opportunities Use rail options to bridge and provide insurance…
Strategy recognizes uncertainties Pursuing a portfolio of options Commitments to new pipeline capacity kbd 300 Currently transporting more than 400 kbd from Alberta by pipeline Secured 290 kbd of additional pipeline 200…
Technology & Innovation
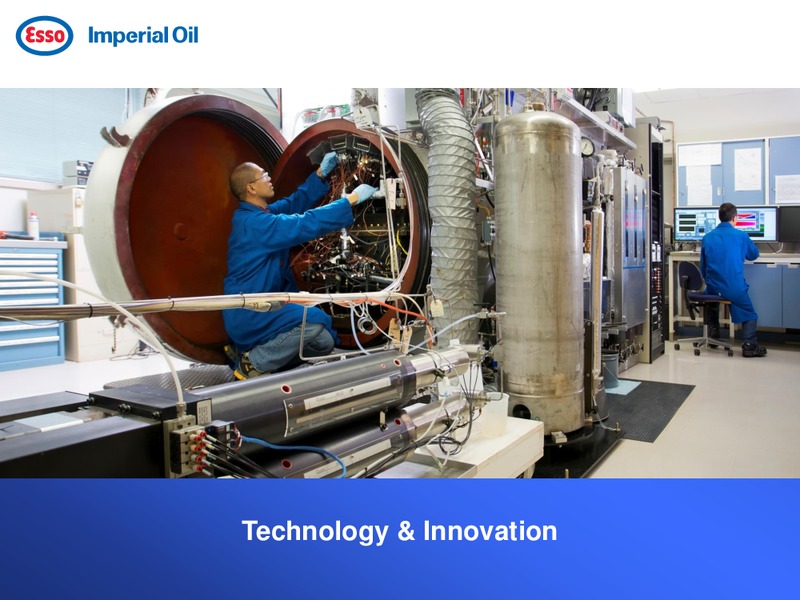
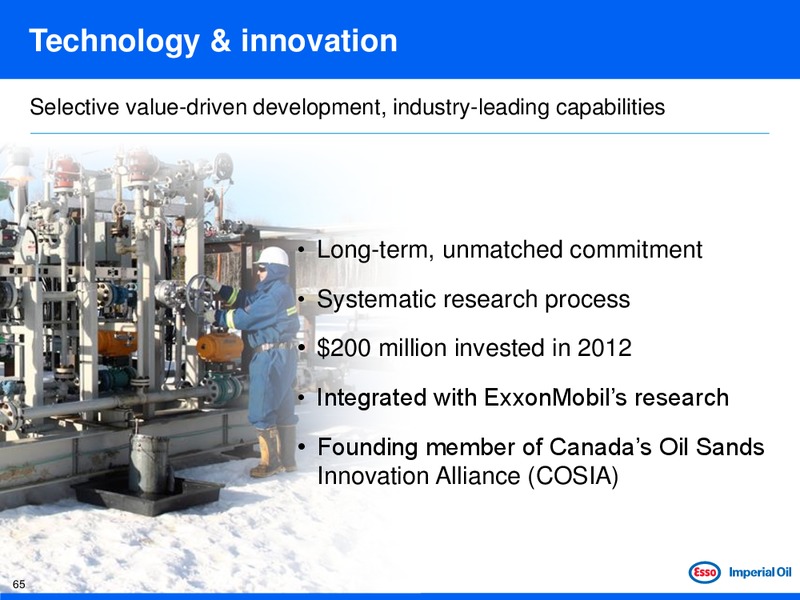
Technology & innovation Selective value-driven development, industry-leading capabilities Long-term, unmatched commitment Systematic research process 200 million invested in 2012 Integrated with ExxonMobils research…
High-impact technologies Focused on fundamental business improvements and long-term value Increase recovery Improve reliability Lower costs Increase margins Improve environmental performance 66
67
Potential game-changing technologies A history of success, organizational commitment to further innovate SA-SAGD CSP Solvent-assisted Cyclic solvent SAGD process CIMA NAE Chemically Non-aqueous induced micro extraction…
Future opportunities Significant growth potential beyond current plans 2012 non-proved resource base billion oeb* 15 Other Gas 10 Growth Mining opportunities 5 Liquids Horn River In-situ Progressing Firebag 0 Aspen 1 2 3…
New in-situ opportunities Development planning underway Resource potential: 3 billion barrels Aspen 100% IOL Ft. McMurray Corner 63% IOL Enabling technology: SAGD/SA-SAGD Grand Rapids 100% IOL Potential scope: 9+ phases…
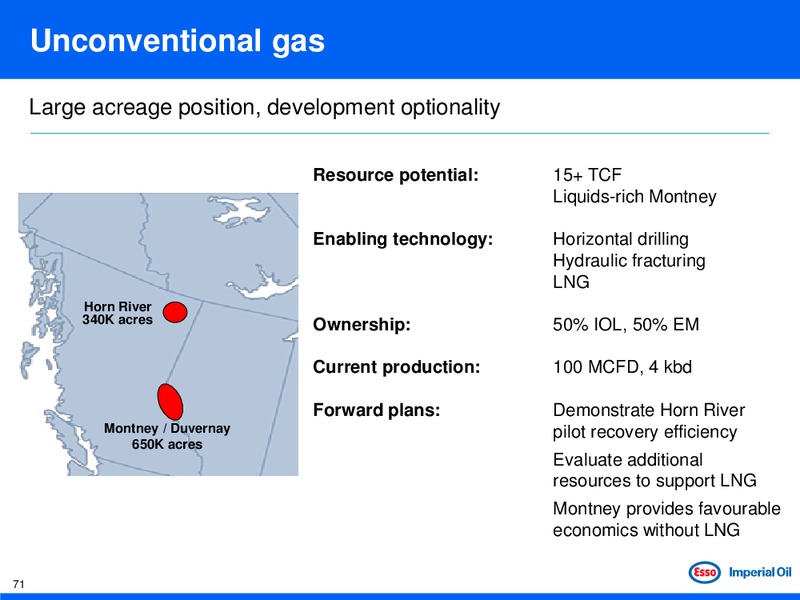
Unconventional gas Large acreage position, development optionality Resource potential: 15+ TCF Liquids-rich Montney Enabling technology: Horizontal drilling Hydraulic fracturing LNG Horn River 340K acres Ownership: 50% IOL,…
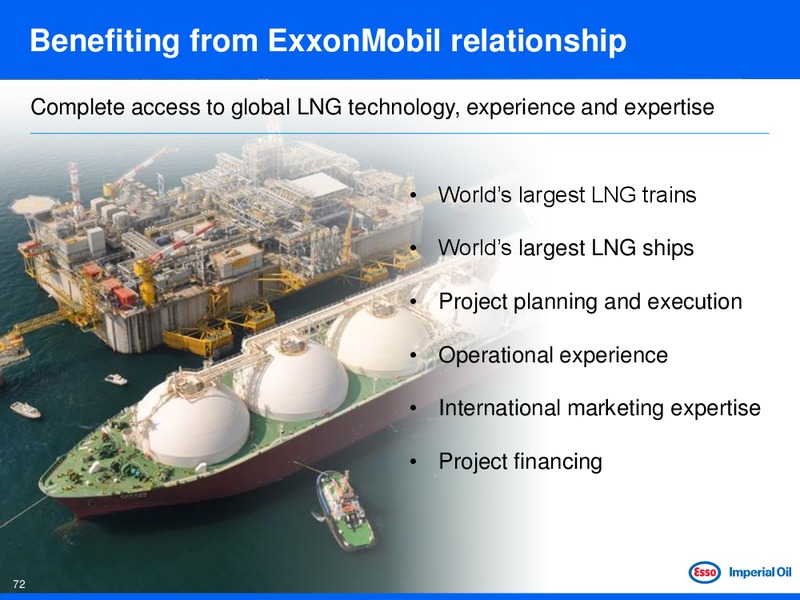
Benefiting from ExxonMobil relationship Complete access to global LNG technology, experience and expertise Worlds largest LNG trains Worlds largest LNG ships Project planning and execution Operational experience…
Long-term growth Potential of 1+ million barrels per day by 2030 Production outlook* kboed 1000 New technologies/opportunities 800 Oil Sands - mining Oil Sands - in-situ 600 Conventional 400 200 0 2010 2020 2030 *…
Final Comments
Imperial Oils business model Deliver superior, long-term shareholder value 1. Long-life, advantaged assets 2. Disciplined investment and cost management 3. Integration and synergies 4. High-impact technologies and…
For more information www.imperialoil.ca For more detailed investor information, or to receive annual and interim reports, please contact: John A. Charlton Manager, Investor Relations Imperial Oil Limited 237 Fourth Avenue SW…
 Loading...