Suncor Investor Information May 2013 Please see legal notice on pages 20 and 21
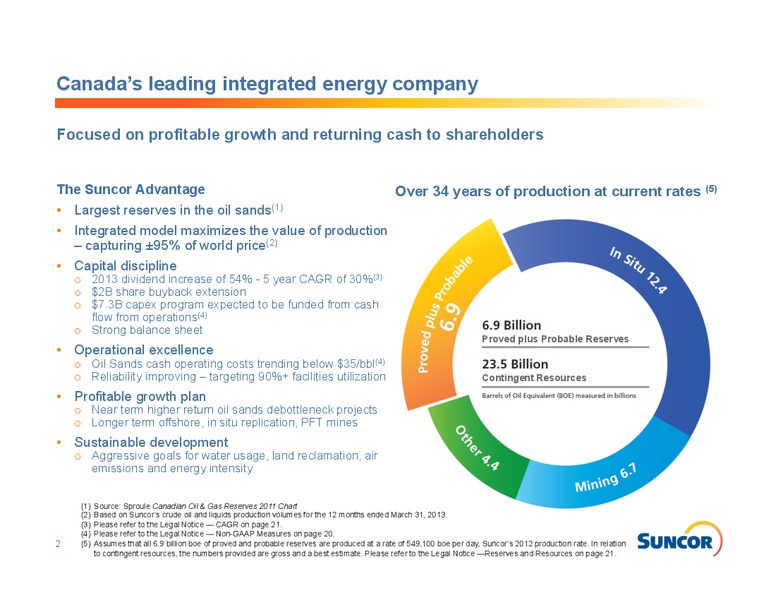
Canadas leading integrated energy company Focused on profitable growth and returning cash to shareholders The Suncor Advantage Over 34 years of production at current rates (5) Largest reserves in the oil sands(1) Integrated model…
Profitable portfolio of oil producing assets Growing oil sands business with complementary upstream & downstream operations Circles are scaled to relative capacities. 3
Largest reserves in the oil sands(1) Monetized through a balanced portfolio of mining, in situ and upgrading(2) Millennium & North MacKay River In Situ Steepbank Extension Mine 30 kb/d of bitumen capacity 310-330 kb/d of bitumen…
Suncors capital allocation priorities Disciplined approach to maximize shareholder returns Return cash to shareholders Competitive, sustainable and growing dividend Value-driven share repurchases Invest in Optimize base…
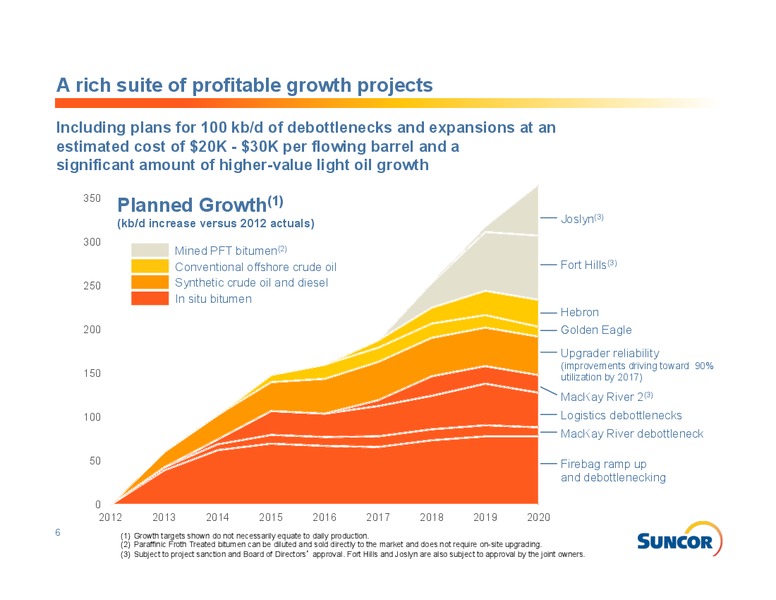
A rich suite of profitable growth projects Including plans for 100 kb/d of debottlenecks and expansions at an estimated 400 cost of 20K - 30K per flowing barrel and a significant amount of higher-value light oil growth 350 Planned…
Access to global market pricing Able to optimize the value of our crude oil production 74% 64% 26% 89% 6% 4% 25% 6% 1% 94% (1) Based on Suncors crude oil and liquids production volumes for the 12 months ended March…
Technology is fundamental to how we do business 175 mm budgeted in 2013 on R&D spending, targeting higher production, enhanced profitability and lower environmental impacts Solvent extraction Membrane de-oiling and water treatment…
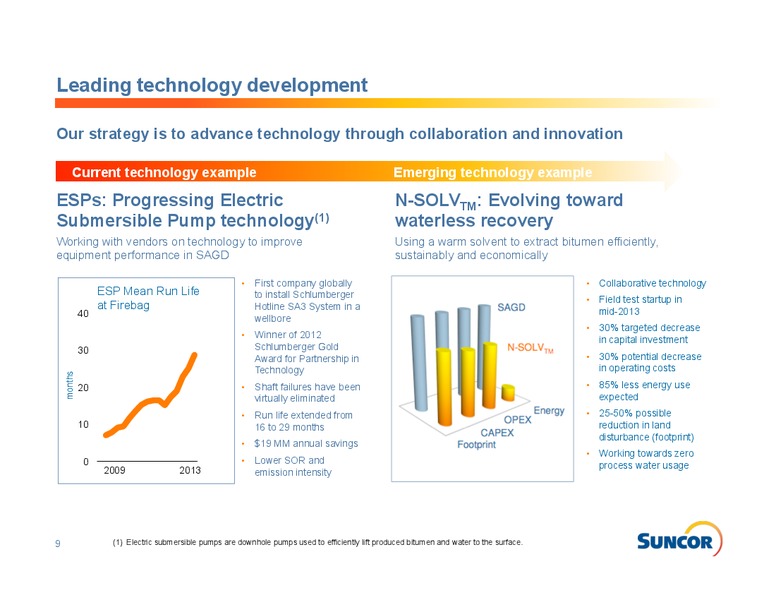
Leading technology development Our strategy is to advance technology through collaboration and innovation Current technology example Emerging technology example ESPs: Progressing Electric N-SOLVTM: Evolving toward Submersible Pump…
Working collaboratively on sustainability Broad recognition for sustainability achievements and CSR reporting Industry Leadership Co-founded OSLI (2009), OSTC (2010) and COSIA (2012) Co-founded OSDG (2000) and CEMA (2003)…
Oil Sands operations set new production records A focus on operational excellence is driving continuous improvement across our business through a structured and disciplined approach to everything we do Improved Reliability Extracted…
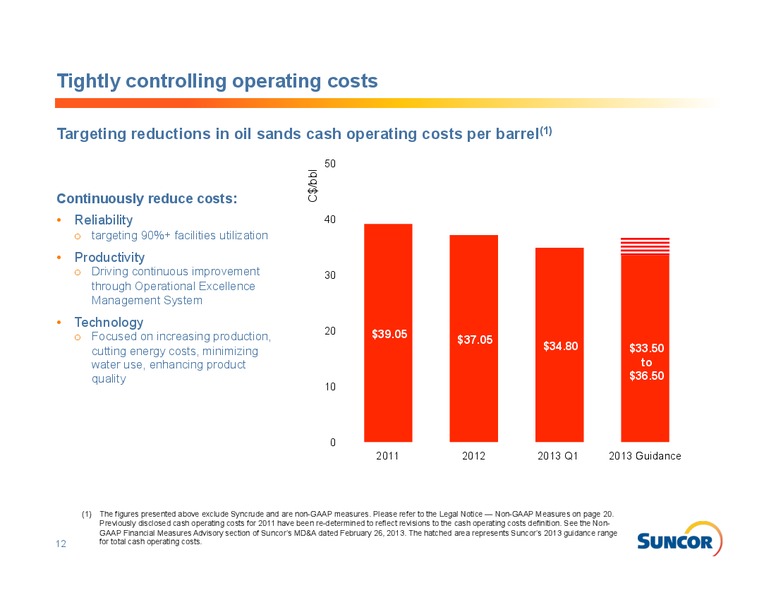
Tightly controlling operating costs Targeting reductions in oil sands cash operating costs per barrel(1) 50 C/bbl Continuously reduce costs: Reliability 40 o targeting 90%+ facilities utilization Productivity o Driving…
Production overview Expecting over 10% oil growth in 2013 2013 2012 Production Outlook Actual Production Oil Sands (bpd) 350,000 380,000 325,000 Syncrude (bpd) 34,000 38,000 34,000 North America Onshore (boe/d) 41,000 46,000(1)…
In Situ operations leading Suncors growth Exceptional portfolio of projects and properties Demonstrated track record of growth Reliable and growing production 175 Firebag 37% CAGR(1) Firebag Stage 4 delivered 15% under budget 150…
Exploration & Productionhigh quality asset base Diversified cash flow and exposure to global pricing Operating earnings (1) Cash flow from operations (1) North America Onshore contribution North America Onshore(2) contribution to to…
Refining & Marketingoptimizing the oil sands barrel Overall 1 among peers for the past three years(1) Edmonton Refinery (140 kb/d) - 100% oil sands integration -35 kb/d heavy feedstock R&M Net Earnings (2) Sarnia Refinery (85 kb/d)…
2013 Capital expenditure outlook 45% growth focused Expect to fund capital spending from cash flow 2013 Outlook Sustaining Capital Growth Capital millions millions millions Oil Sands 4,195 2,960 1,235 Oil Sands 3,110 2,540 570…
Financial strength Maintaining a strong balance sheet and spending within our means 12 months ended Enables Suncor to grow profitably and Mar 31, 2013 Target accelerate return of cash to shareholders 2013 planned capital spending…
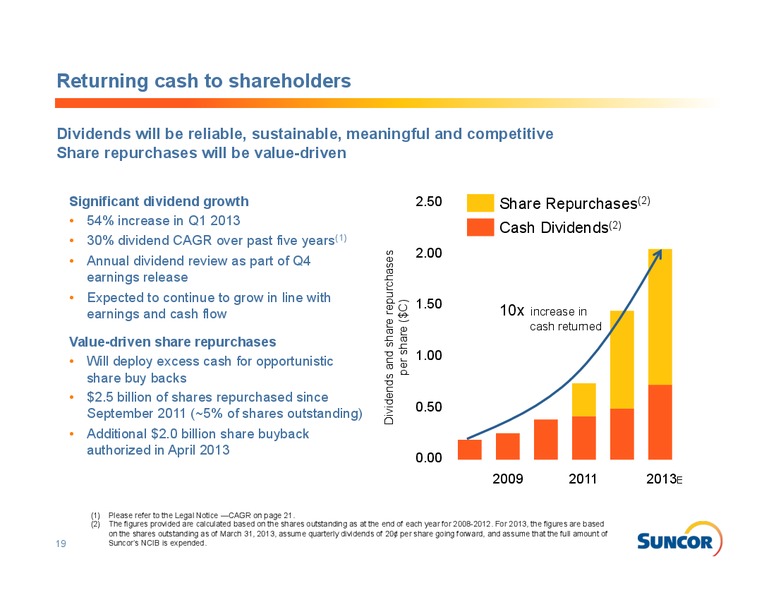
Returning cash to shareholders Dividends will be reliable, sustainable, meaningful and competitive Share repurchases will be value-driven Significant dividend growth 2.50 Share Repurchases(2) 54% increase in Q1 2013 Cash…
Legal notice (continued) Operating earnings and cash flow from operations for Suncors Exploration and Production segment for 2009 to 2012 are defined and reconciled in Suncors MD&A dated February 26, 2013, and in the case of cash flow…
 Loading...