Regency g y Energy gy Partners Investor Day Presentation March 30, 2010
Agenda Introduction 2009 Highlights Fundamentals Overview Mission and Strategy What Differentiates Regency Transportation Segment Overview Gathering and Processing Segment Overview Contract Compression Segment Overview…
2009 Highlights
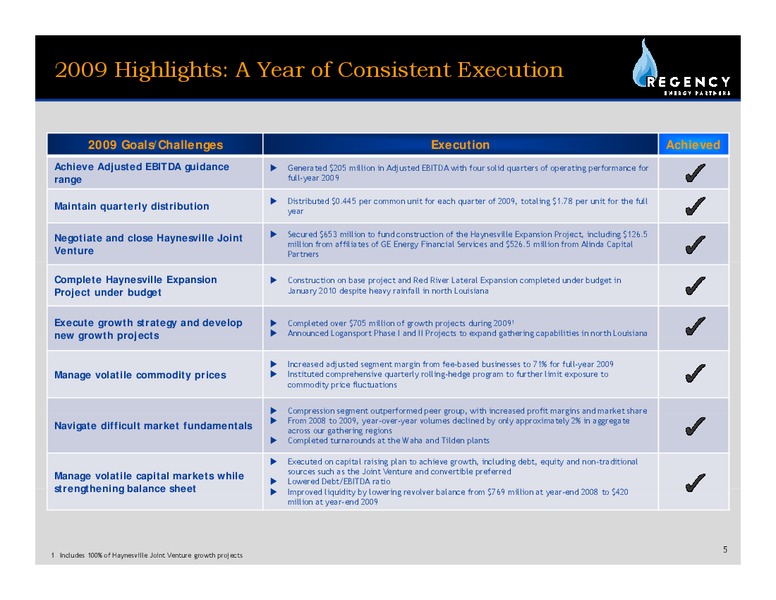
2009 Highlights: A Year of Consistent Execution 2009 Goals/Challenges Execution Achieved Achieve Adjusted EBITDA guidance X Generated 205 million in Adjusted EBITDA with four solid quarters of operating performance for range full-year…
Fundamentals Overview
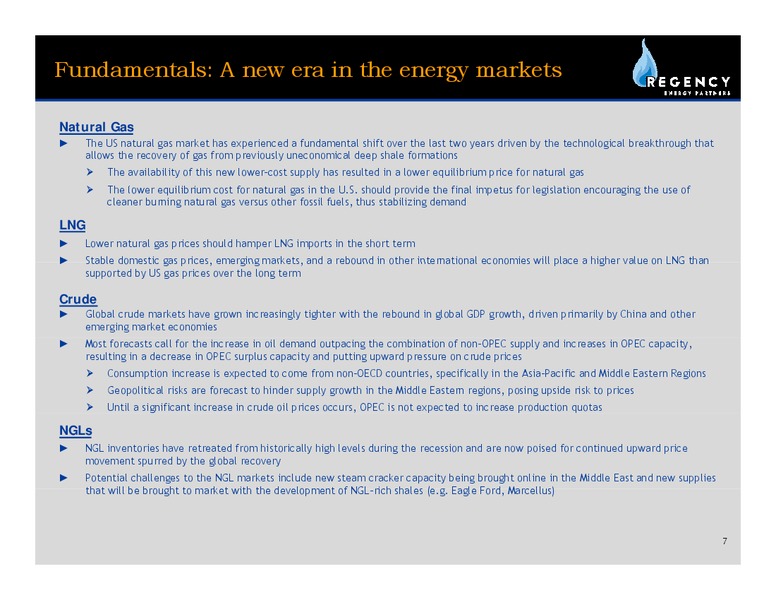
Fundamentals: A new era in the energy markets Natural Gas The US natural gas market has experienced a fundamental shift over the last two years driven by the technological breakthrough that allows the recovery of gas from previously…
Fundamentals: Natural Gas Demand Growth Forecast Natural gas demand is forecast to increase by 4.7% from 2010 to 2025 based on EIA forecasts Natural gas is an inexpensive source of domestic fuel with ample supply Natural G Gas C…
Fundamentals: Natural Gas Supply Growth Forecast X Gas from shale plays is expected to increase 40% over the next five years, primarily driven by the Marcellus, Haynesville, Fayetteville, and Eagle Ford Shales X Oil-associated gas, a…
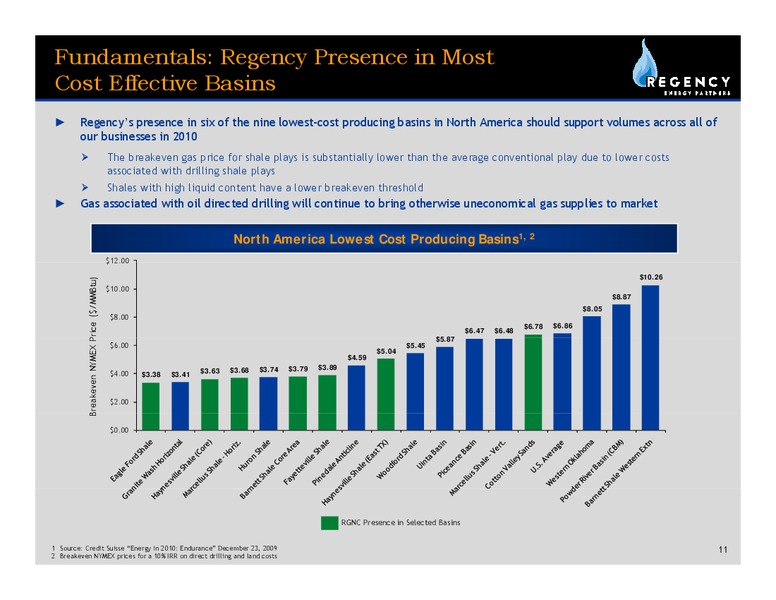
Fundamentals: Regency Presence in Most Cost Effective Basins Regencys presence in six of the nine lowest-cost producing basins in North America should support volumes across all of our businesses in 2010 The breakeven gas price for…
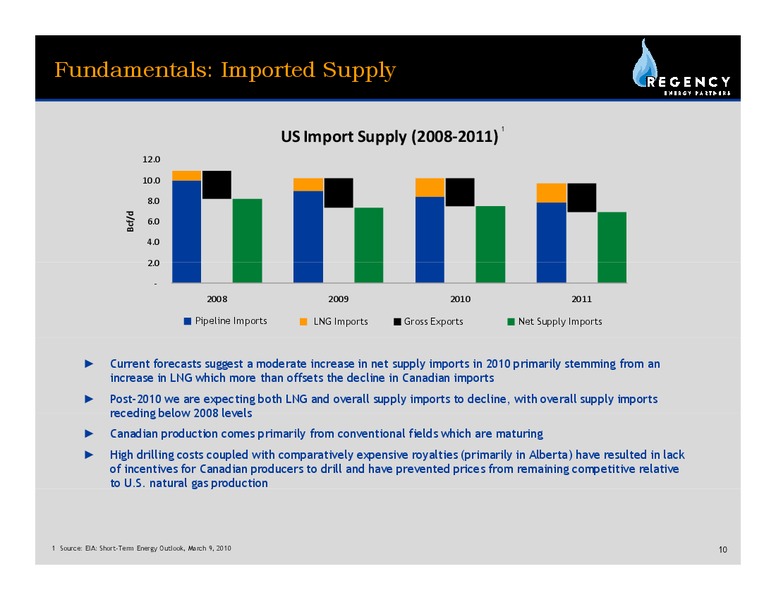
Fundamentals: Global Crude Markets 1 2 Global Oil Supply and Demand Forecasted Global Crude Spare Capacity (1990 2014) (2010-2014) 93.0 100.0 120.0 Actual Forecast 92.0 95.0 100.0 100.0 91 0 91.0 90.0 90.0 80.0…
Fundamentals: Impact to Regency Gas from shale plays is expected to become an increasingly larger source of supply over the next decade Regencys Regency s presence in several of the lowest cost producing basins in the U.S. U S…
Mission and Strategy
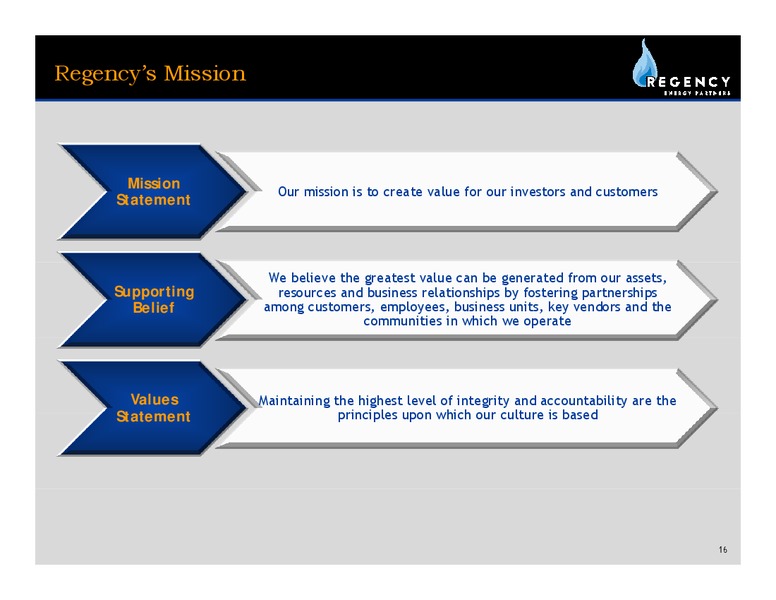
Regencys Mission Mission Our O mission i i iis to create value l ffor our iinvestors and d customers Statement We believe the greatest value can be generated from our assets, Supporting resources and business relationships…
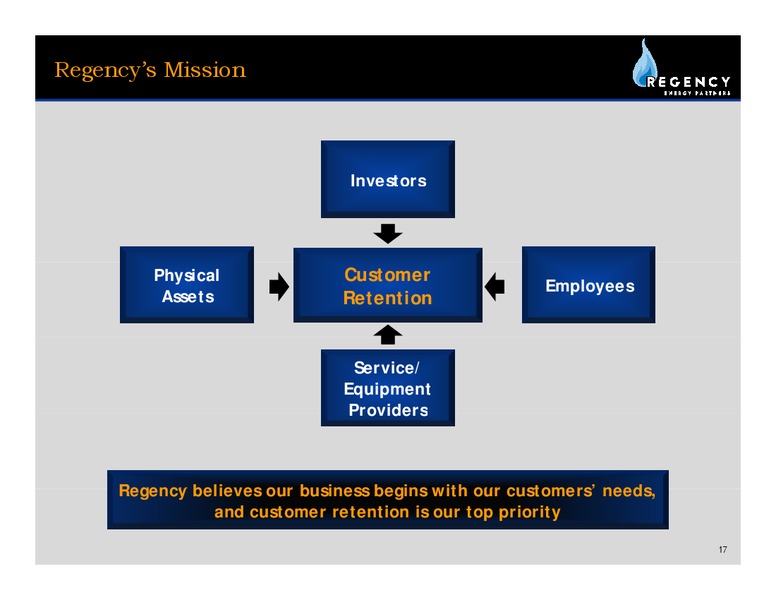
Regencys Mission Investors Physical Customer Employees Assets Retention Service/ Equipment Providers Regency believes our business begins with our customers customers needs, needs and customer retention is our top…
Driving Value: Commercial and Operational Focus Customer Daily Point of Contact Commercial and Information Engineering Operations Technology Personnel Environmental, Accounting Health & Safety Human Resources Finance…
Driving Investor/Customer Value: Securing and Expanding the Core f We believe we can expand our core businesses by building on our existing customer relationships and capabilities Identify and retain high value customers by…
Securing and Expanding the Core: Shale Plays Key Shale Play Regencys Focus Transportation Completion of the Haynesville Expansion Project and Red River Lateral bring total takeaway capacity to 2.1 Bcf/d Pursuing expansion projects…
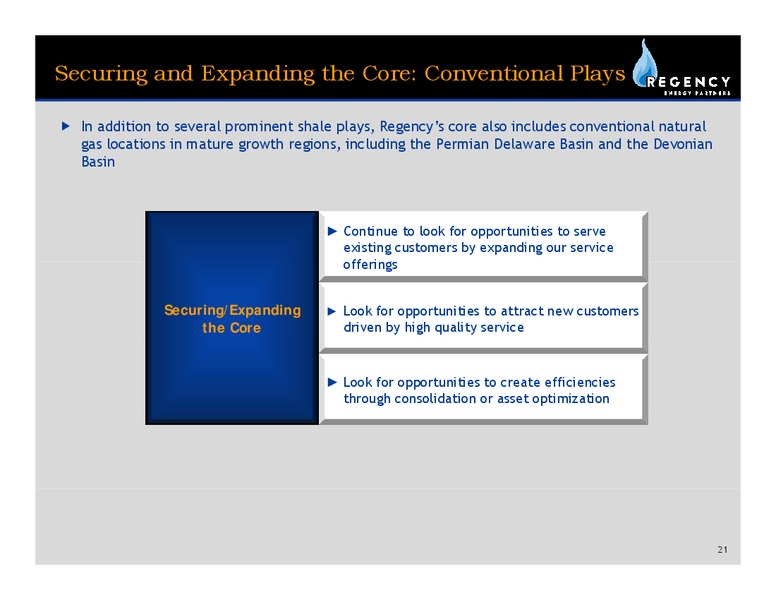
Securing and Expanding the Core: Conventional Plays f In addition to several prominent shale plays, Regencys core also includes conventional natural gas locations in mature growth regions, including the Permian Delaware Basin and the…
Driving Investor/Customer Value: Beyond the Core f Regency will opportunistically evaluate potential acquisitions or greenfield development beyond our core to expand into new regions and diversify our value chain Potential overlap…
Key Long-Term Objectives Long-Term Objectives Consistent g growth in cash available for distribution Financial Goals Achieve investment grade metrics Align commercial and operational efforts to create most value for customers…
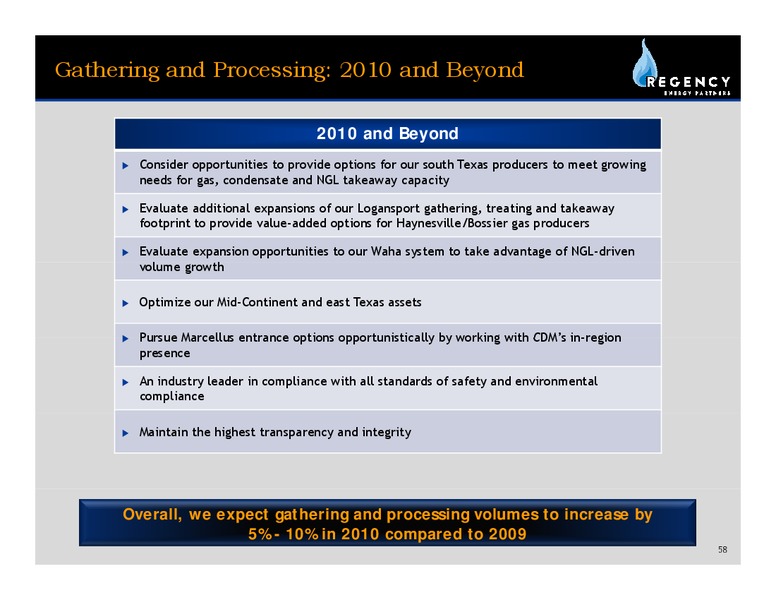
Key 2010 Operational Assumptions Business Segment 2010 Forecast Key Assumptions X Fee-based gathering margins are X 5% to 10% increase in volumes in generally lower than margins for Gathering and Processing aggregate for Regency…
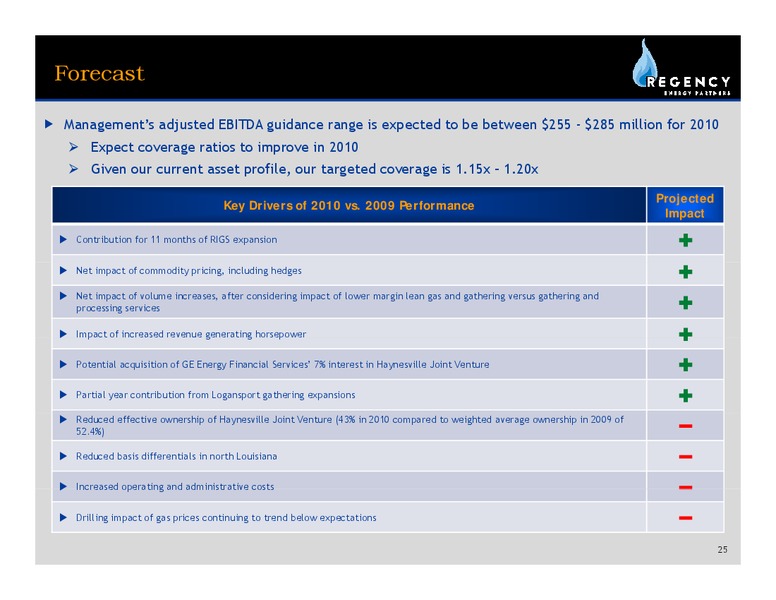
Forecast f Managements adjusted EBITDA guidance range is expected to be between 255 - 285 million for 2010 Expect coverage ratios to improve in 2010 Given our current asset profile, our targeted coverage is 1.15x 1.20x Projected Key…
What Differentiates Regency g y
What Differentiates Regency Strong St g SSponsor Diverse Portfolio Geographic Reach Fee-Based F B d Growth G h What Differentiates Full-Service Midstream Provider Regency Sustainable Advantages Strategy Drives…
What Differentiates Regency: Strong Sponsorship GE Energy Financial Services financial strength and expertise in the midstream sector make it a strong sponsor and an attractive strategic partner Since its acquisition of Regencys…
What Differentiates Regency: Diverse Portfolio 2009 Gross Margin by Region Region ASSET SUMMARY 4 180 Gathering Pipeline 5,595 miles 160 153 140 Treating/Processing Plants 9 120 in millions 100 Intrastate Pipeline5 450…
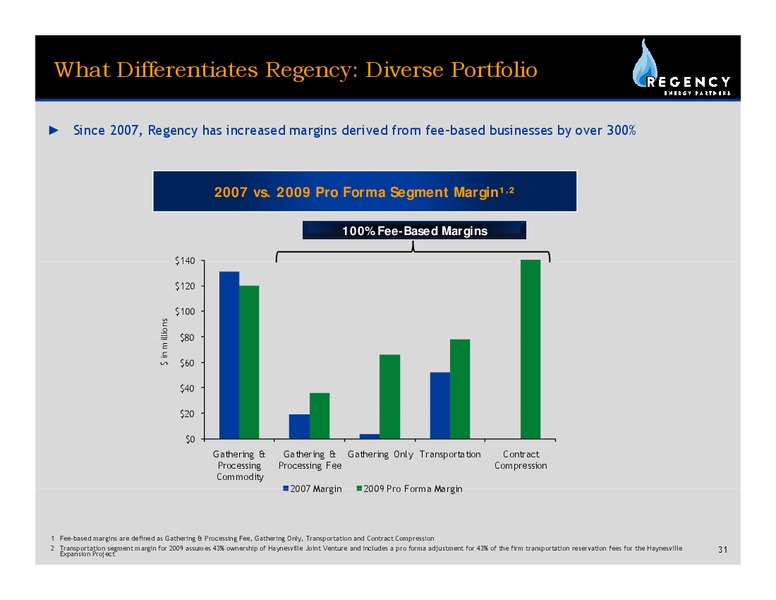
What Differentiates Regency: Diverse Portfolio Since 2007, Regency has made a concerted effort to grow fee-based margins 71% of Regencys Adjusted Segment Margin in 2009 was attributable to stable, fee-based cash flows Only 5% of…
What Differentiates Regency: Diverse Portfolio Since 2007, Regency has increased margins derived from fee-based businesses by over 300% 2007 vs. 2009 P Pro F Forma S Segment M i , Margin 100% Fee-Based Margins 140 120…
What Differentiates Regency: Full-Service Provider f From the wellhead to market, Regency offers a full range of midstream natural gas services, including gathering and processing, contract compression, transportation and marketing of…
What Differentiates Regency: Sustainable Advantages By investing in our sustainable advantages, Regency increases profit potential for our customers Value-Added Sustainable Advantages Producer Services Broad, Deep Expand…
What Differentiates Regency: Strategy Drives Consistency of Focus f Consistently focus on long-term objectives f Maximize value from customer relationships Leveraging strategic locations of assets and long-term customer relationships…
Transportation Segment Overview
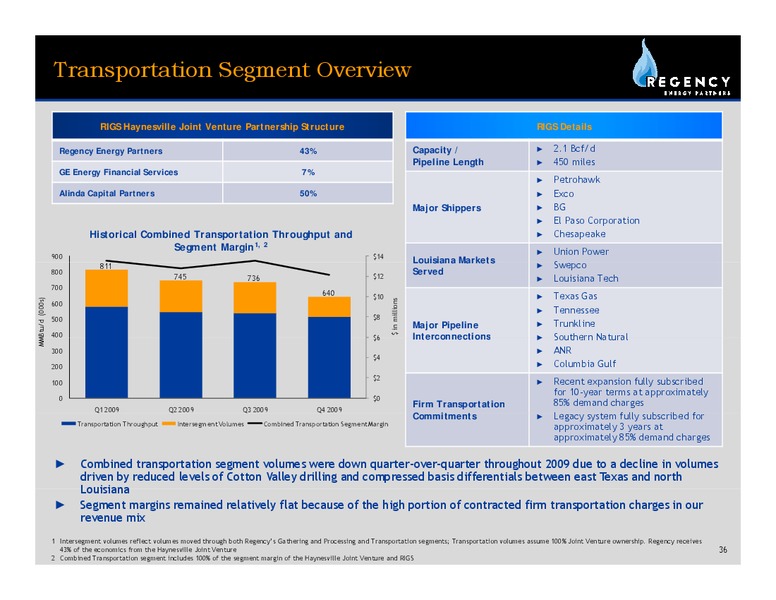
Transportation Segment Overview RIGS Haynesville Joint Venture Partnership Structure RIGS Details Regency Energy Partners 43% Capacity / 2.1 Bcf/d Pipeline Length 450 miles GE Energy Financial Services 7% Petrohawk Alinda Capital…
Transportation Segment: Haynesville Expansion Project The Haynesville Expansion Project is the first material increase in capacity that has come online in the Haynesville Shale Haynesville y Expansion p Project: 653mm Red…
Transportation Segment Opportunities Haynesville / Bossier Growth Since the initial well results from the Haynesville Shale became public in early 2008, drilling activity has continued to increase due to the low production costs…
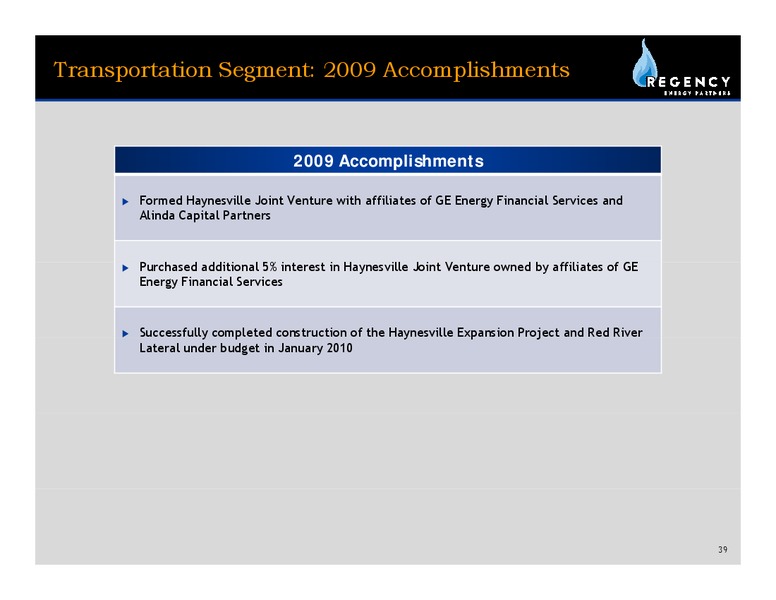
Transportation Segment: 2009 Accomplishments 2009 Accomplishments X Formed Haynesville Joint Venture with affiliates of GE Energy Financial Services and Alinda Capital Partners X Purchased P h d additional ddi i l 5% interest…
Transportation Segment: 2010 and Beyond 2010 and Beyond X Evaluate expansion opportunities of the RIGS system to provide additional capacity to g Haynesville/ bring y Bossier g gas to market and develop p additional takeawayy…
Gathering & Processing Segment g Overview
Gathering and Processing: Asset Overview Regencys gathering and processing operations are primarily located in Texas, Louisiana, Oklahoma and Kansas1 East Texas Mid-Continent Plants 1 Plants2 1 Gathering System 371 Gathering System…
Gathering and Processing Segment Despite a difficult commodity environment, including a steep decline in gas prices for the first three quarters of 2009, Regencys Gathering and Processing volumes and segment margin have remained…
Gathering and Processing: North Louisiana Key Assets Dubach Processing Plant 95 MMcf/d Lisbon Plant Lisbon Processing Plant 30 MMcf/d Dubach Plant D bb l Refrigeration Dubberly R f ig ti PlPlantt 200 MM MMcf/d f/d Dubberly…
Gathering and Processing: North Louisiana Regional Production1 Margin by Type2 2,000,000 60% 1,800,000 1,600,000 50% 1,400,000 1,200,000 40% 1,000,000 30% 800,000 56% Mcf/d 600,000 20% 400,000 27% 200,000 10%…
Gathering and Processing Opportunity: Haynesville/Bossier Shales Regencys Logansport Expansions are expected to add an incremental 450-485 MMcf/d of gathering capacity, an incremental 435 MMcf/d of takeaway capacity and an incremental…
Gathering and Processing: South Texas Key Assets Tilden Treating Plant 400 GPM Fashing Treating Edwards Lime JV 350 GPM Tild (L Tilden (Lean/Sour) /S ) G Gathering h i SSystem 60 MM MMcf/d f/d Tilden (Rich/Sour) Gathering…
Gathering and Processing: South Texas Regional Production1 Margin by Type2 1,200,000 50% 45% 1,000,000 40% 800,000 35% 30% 600,000 Mcf/d 25% 20% 43% 400,000 34% 15% 10% 200,000 14% 5% 8% - 0% Gas Margin NGL Margin…
Gathering and Processing Opportunity: Eagle Ford Shale Eagle Ford Shale: Condensate Economics Attractive condensate yields, which drive producer economics, will fuel further drilling and development of the Eagle Ford region The p…
Gathering and Processing Opportunity: Eagle Ford Shale The Eagle Ford Shale directly overlays Regencys existing south Texas gathering infrastructure and provides gathering and compression opportunities Eagle Ford can be divided into…
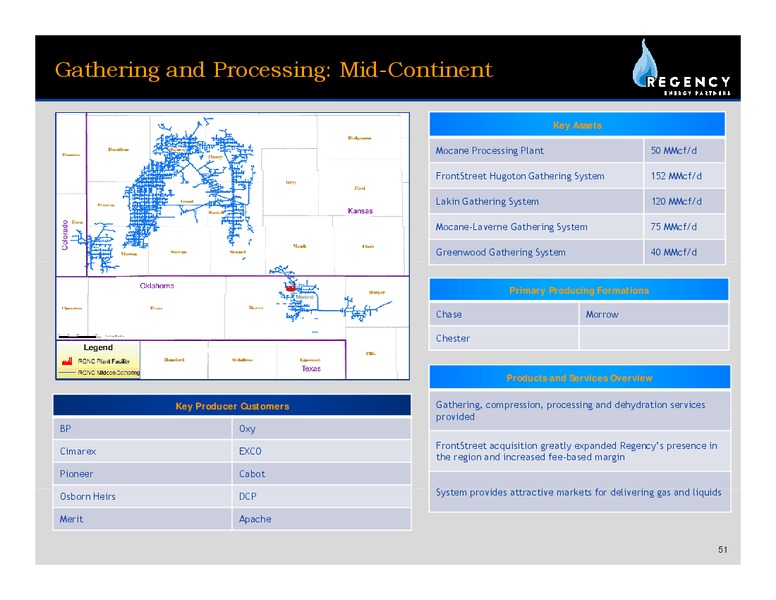
Gathering and Processing: Mid-Continent Key Assets Mocane Processing Plant 50 MMcf/d FrontStreet Hugoton Gathering System 152 MMcf/d Lakin Gathering System 120 MMcf/d Mocane-Laverne Gathering System 75 MMcf/d Greenwood…
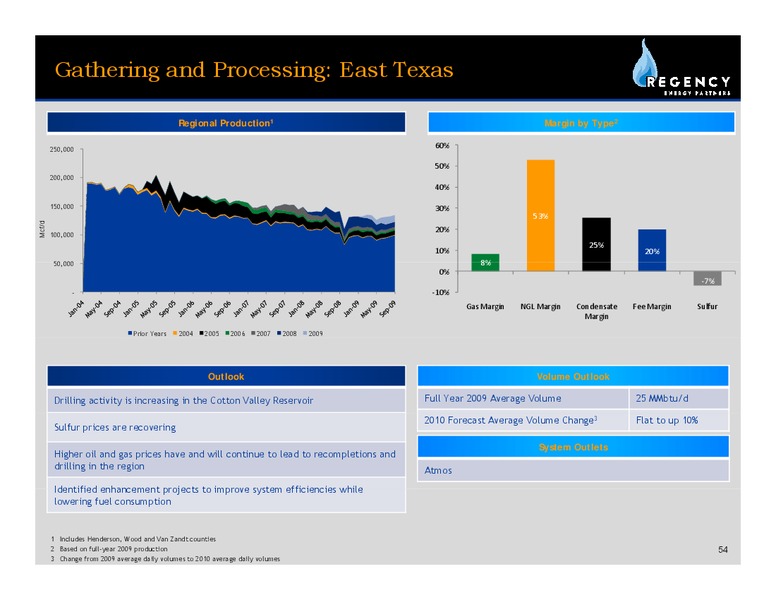
Gathering and Processing: East Texas Key Assets Eustace Treating Plant 3,150 GPM Eustace Processing Plant 50 MMcf/d East Texas Gathering System 100 MMcf/d Myrtle Springs Liquid Treating 88 GPM Primary Producing Formations…
Gathering and Processing: East Texas Regional Production1 Margin by Type2 250,000 60% 50% 200,000 40% 150,000 30% 53% Mcf/d 20% 100,000 25% 10% 20% 50 000 50,000 8% 0% 7% - 10% Gas Margin NGL Margin Condensate…
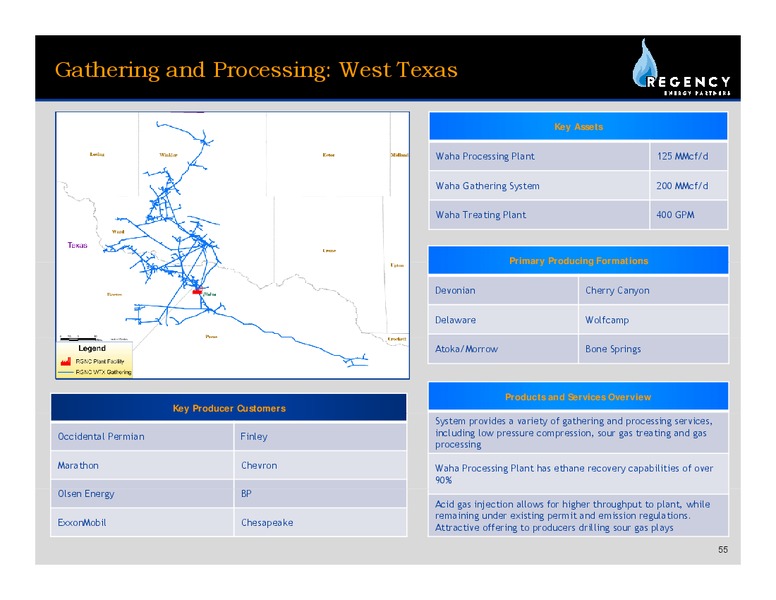
Gathering and Processing: West Texas Key Assets Waha Processing Plant 125 MMcf/d Waha Gathering System 200 MMcf/d Waha Treating Plant 400 GPM Primary Producing Formations Devonian Cherry Canyon Delaware Wolfcamp…
Gathering and Processing: West Texas Regional Production1 Margin by Type2 1,400,000 70% 1,200,000 60% 1 000 000 1,000,000 50% 800,000 40% Mcf/d 600,000 30% 65% 400,000 20% 200,000 10% 21% 2% 13% - 0% Gas Margin…
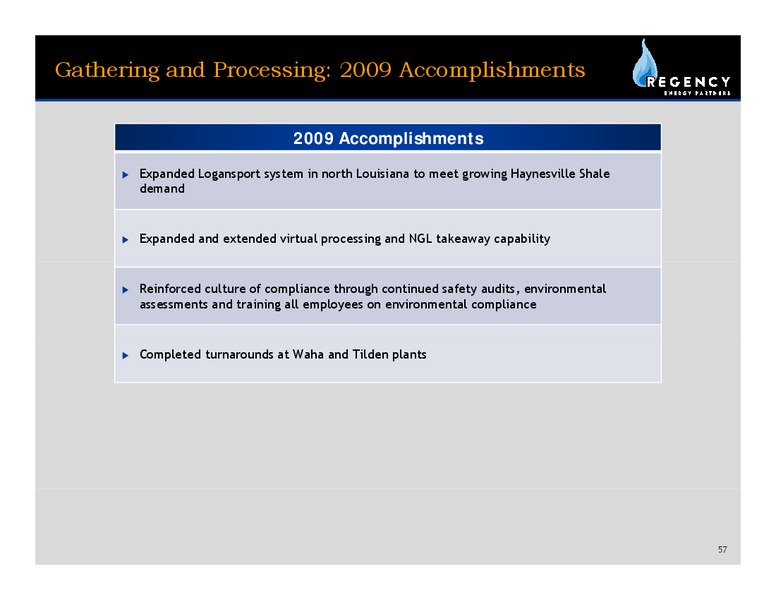
Gathering and Processing: 2009 Accomplishments 2009 Accomplishments X Expanded Logansport system in north Louisiana to meet growing Haynesville Shale demand X Expanded and extended virtual processing and NGL takeaway capability…
Gathering and Processing: 2010 and Beyond 2010 and Beyond X Consider opportunities to provide options for our south Texas producers to meet growing needs for g gas,, condensate and NGL takeawayy capacity p y X Evaluate additional…
Contract Compression Segment g Overview
Contract Compression Overview Core compression operations in Texas, Louisiana, Arkansas and Pennsylvania HP by Region, Region Total HP of Units Gulf Coast 250,618 316 West 285,908 392 North 216,802 179 Total 753,328 887 HP by…
Contract Compression: Uses of Compression Regencys full-service contract compression operations provide our customers with turnkey services that adapt to changing conditions, thereby helping producers increase their production and cash…
Contract Compression: Historical Performance Despite a 46% decline in the U.S. onshore gas rig count Regencys 2009 performance demonstrates that our since September 2008, Regencys revenue generating business model is stable, with…
Contract Compression: Improved Performance Compression EBITDA Margins: RGNC Contract Compression Performance RGNC vs. Oil Field Services Peer Group1,2 60% 90 52% 52% 55% 51% 52% of Revenue (%) 80 50% EBITDA as a…
Contract Compression: Improved Performance Between 2005 and 2009, Regency captured 45% of the cumulative growth in the outsourced compression market Between 2005 and 2009, Regency continuously grew its share of the outsourced…
Contract Compression: Benefits With the acquisition of our contract compression segment in January 2008, Regency added a rapidly growing, complementary fee-based business segment which created significant synergies in its existing…
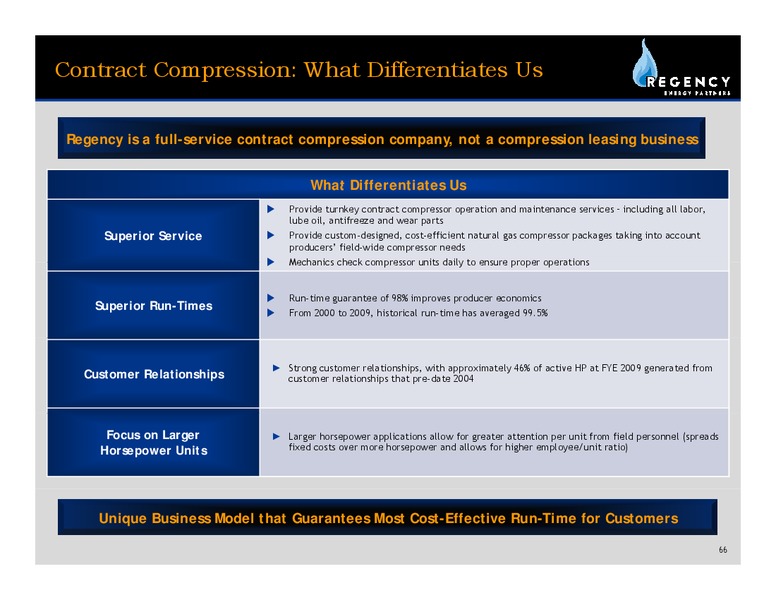
Contract Compression: What Differentiates Us Regency is a full-service contract compression company, not a compression leasing business What Differentiates Us X Provide turnkey contract compressor operation and maintenance services…
Contract Compression Opportunity: 2010 and Beyond Regency is well-positioned for growth in the shale plays through its contract compression segment Compression Shale Play Horsepower Deployed1 Regency Growth Trend Opportunity Regency…
Contract Compression: 2009 Accomplishments 2009 Accomplishments X Horsepower remained relatively steady with only an approximate 3% decline in 2009 versus 2008, despite drastic reduction in rig counts X Maintained approximately…
Contract Compression: 2010 and Beyond 2010 and Beyond X Evaluate opportunities to establish significant position in Marcellus Shale X Develop strategy to position multi-service growth in Haynesville and Eagle Ford Shales X…
Financial Overview
Key Highlights: Enhanced Financial Strength f Despite the challenging market environment, environment Regency strengthened its financial position by achieving our EBITDA guidance range, accessing the capital markets to prudently fund…
Financial Goals Summary Key Financial Goals X Maintain comprehensive hedging program to limit exposure to commodity price and Risk Management interest rate fluctuations X Continued focus on organic growth projects, projects…
Financial Goals: Risk Management f Regency believes that maintaining a strong hedging program enables us to more accurately project and maintain stable cash flows f We expect to execute additional hedges for 2011 soon to bring our 2011…
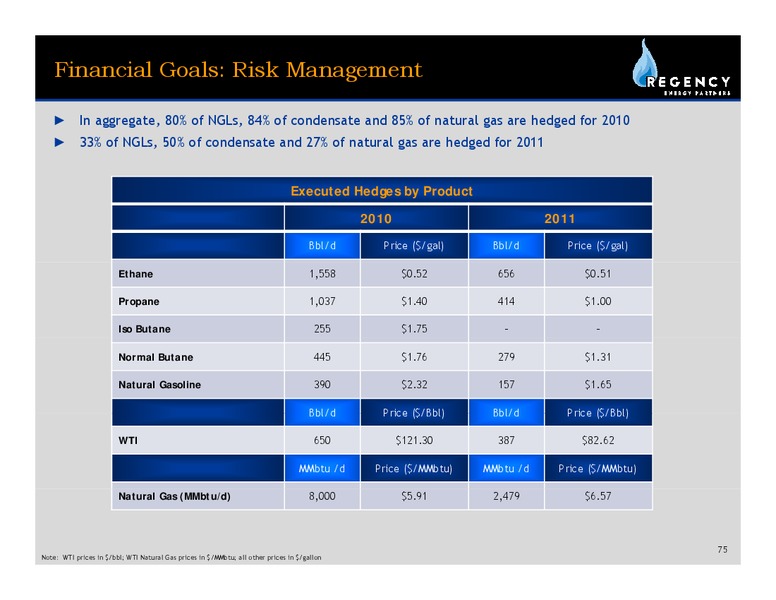
Financial Goals: Risk Management In aggregate, 80% of NGLs, 84% of condensate and 85% of natural gas are hedged for 2010 33% of NGLs, 50% of condensate and 27% of natural gas are hedged for 2011 E Executed t dHHedges d by b…
Financial Goals: Evaluation of Growth X Balance growth in long-term value with near-term accretion to maximize return on invested capital (ILLUSTRATIVE EXAMPLE) R l ti E Relative Economics i High Growth Investment Stable Low…
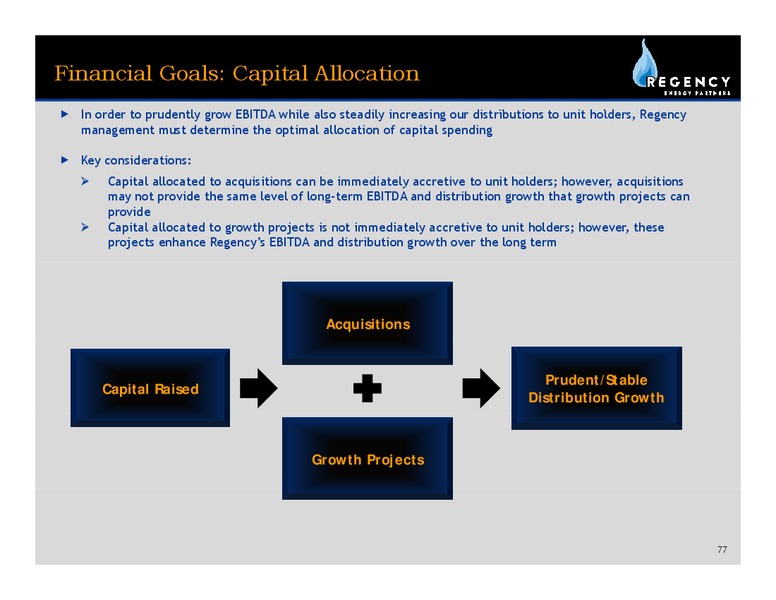
Financial Goals: Capital Allocation f IIn order d tto prudently d tl grow EBITDA while hil also l steadily t dil iincreasing i our didistributions t ib ti tto unit it h holders, ld R Regency management must determine the…
Financial Goals: Evaluation of Growth Step-Out Bolt-On Acquisitions Acquisitions Organic Growth Total 1,047 million 300 million 1,439 million 2,786 million Pueblo 2005 179 TexStar 349 64 Midstream 2006 122 Nexus Gas 89 2007…
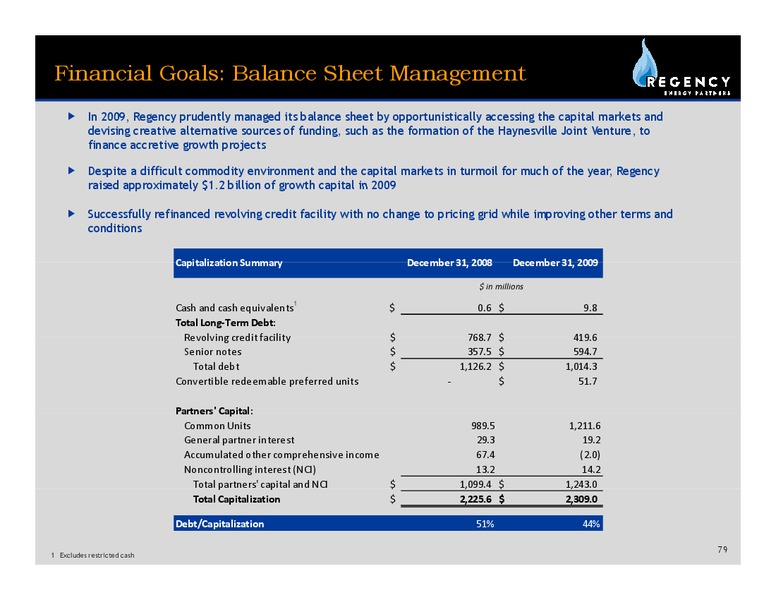
Financial Goals: Balance Sheet Management f In 2009, Regency prudently managed its balance sheet by opportunistically accessing the capital markets and devising creative alternative sources of funding, such as the formation of the…
Financial Goals: Investment Grade Metrics1 f Regency believes achieving investment grade metrics will provide us access to the lowest cost of capital, thereby enabling us to continue to execute on our growth strategy Obtain Obt i…
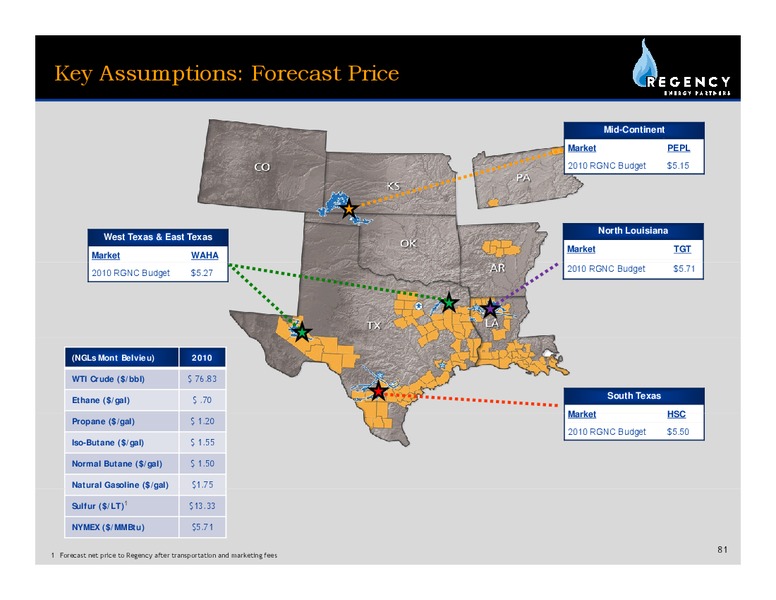
Key Assumptions: Forecast Price Mid-Continent Market PEPL 2010 RGNC Budget 5.15 North Louisiana West Texas & East Texas Market TGT Market WAHA 2010 RGNC Budget 5.71 2010 RGNC Budget 5.27 (NGLs Mont Belvieu) 2010 WTI…
Key 2010 Assumptions: DCF Analysis DCF Sensitivity to Commodity Price Changes - 2010 Change in WTI Price (/bbl) Change in Natural Gass ( in millions) Decrease 10.00 Flat Increase 10.00 e (/MMbtu) Decrease 1.00 (3.0) (0.5)…
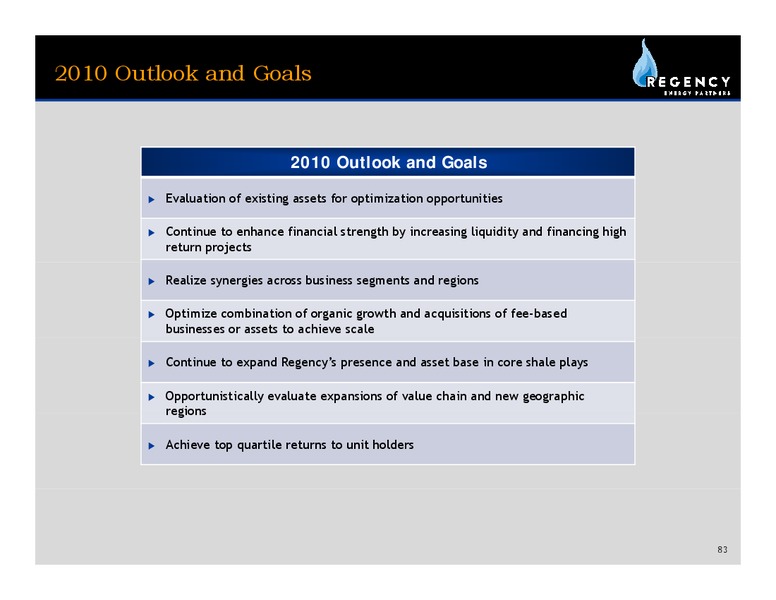
2010 Outlook and Goals 2010 Outlook and Goals X Evaluation of existing assets for optimization opportunities X Continue to enhance financial strength by increasing liquidity and financing high return projects X Realize synergies…
Conclusion
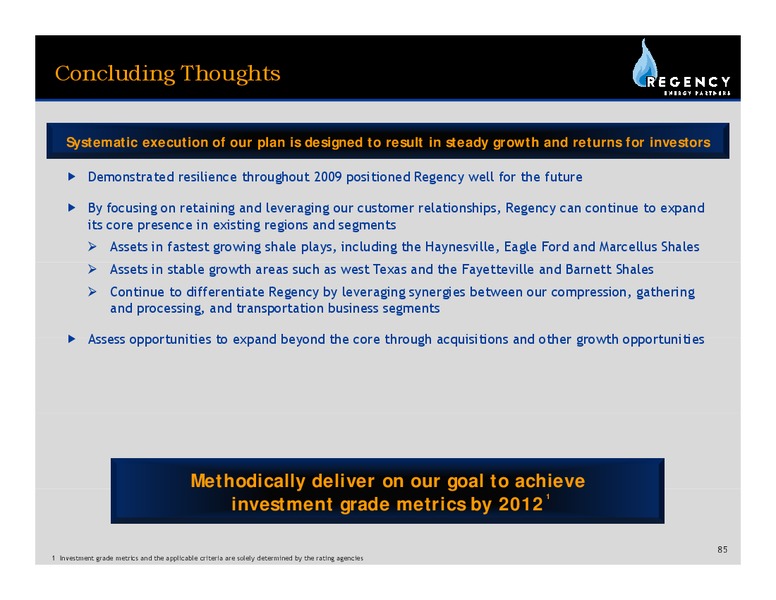
Concluding Thoughts Systematic execution of our plan is designed to result in steady growth and returns for investors f Demonstrated resilience throughout 2009 positioned Regency well for the future f By focusing on retaining and…
Concluding Thoughts Regency plans to continue our solid track record of growth through potential acquisitions and organic growth projects Segment Potential Opportunities X Expansion of the RIGS system to provide additional…
Q&A
Appendix
Non-GAAP Reconciliation Three Months Ended December 31 Year Ended December 31, 2009 2008 2009 2008 ( in thousands) Net (loss) income (3,347) 31,936 140,489 101,328 Add (d (deduct): d t) Interest expense, net 22,028 14,982 77,996…
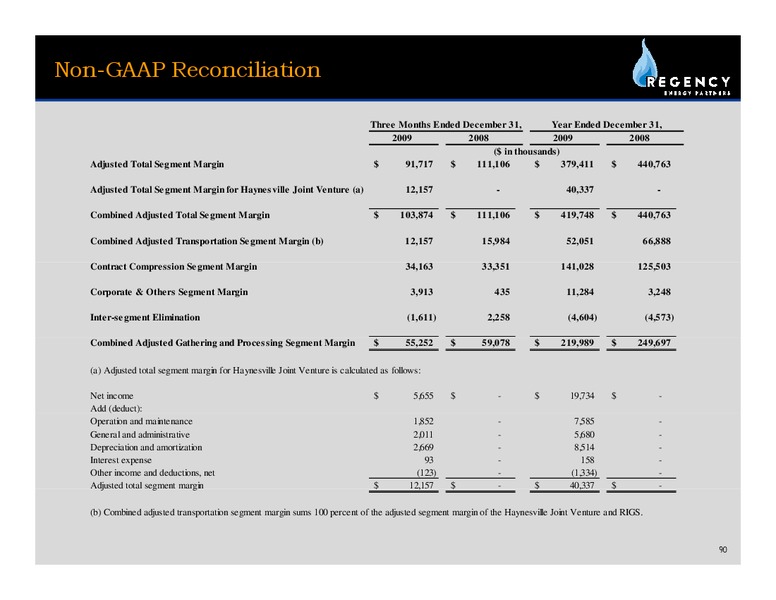
Non-GAAP Reconciliation Three Months Ended December 31, Year Ended December 31, 2009 2008 2009 2008 ( in thousands) Adjusted Total Segment Margin 91,717 111,106 379,411 440,763 A j Adjusted Total S Segment Margin i ffor…
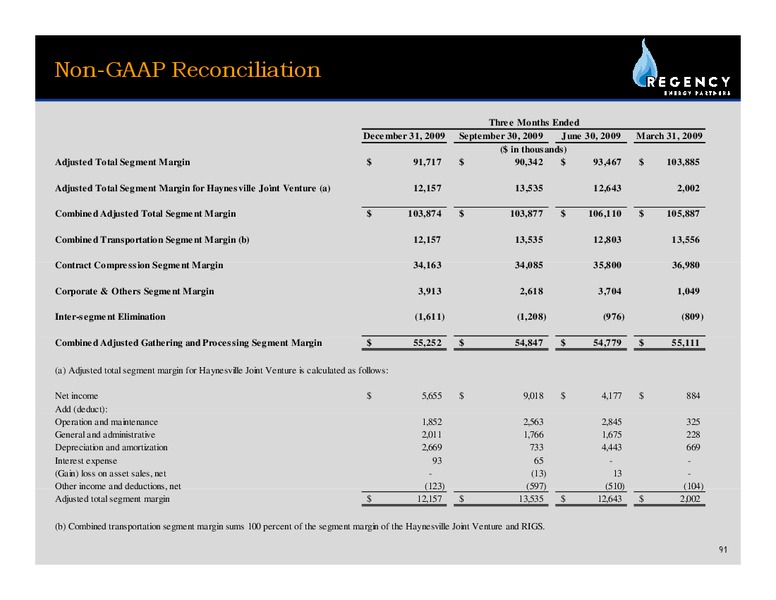
Non-GAAP Reconciliation Three Months Ended December 31, 2009 September 30, 2009 June 30, 2009 March 31, 2009 ( in thousands) Adjusted Total Segment Margin 91,717 90,342 93,467 103,885 Adj t d T Adjusted Total t lSSegmentt M Margin…
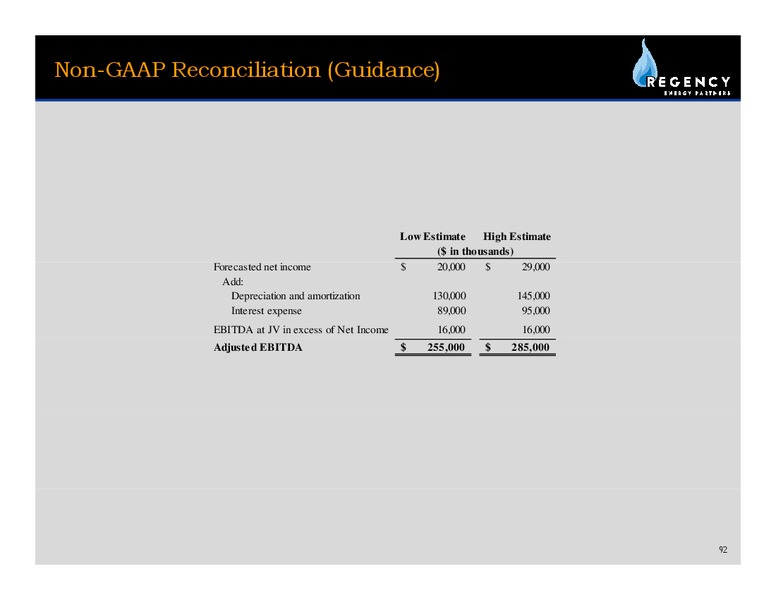
Non-GAAP Reconciliation (Guidance) Low Estimate High Estimate ( in thousands) Forecasted net income 20,000 29,000 Add: Depreciation and amortization 130,000 145,000 Interest expense 89,000 95,000 EBITDA at JV in excess of Net…
 Loading...