Regency Energy Partners UBS MLP Conference September 2008
Overview, Strategy & Vision
Formula for Success Regency GE EFS Partnership Dedicated and GREATER Experienced Strong Sponsor Greater GROWTH Growth Management Team Potential POTENTIAL X Active merger and acquisition X Regency is the principal X Solely…
Our Mission and Key Objective Mission Key Objective Consistent growth in unit holder value Implications X Obtain scale in our business segments and regions X Manage using a results-oriented organizational philosophy X Balance…
Our Mission and Key Objective Mission Key Objective Consistent growth in unit holder value Implications Haynesville Project - 1.1 billion project will add 1.45 Bcf of takeaway capacity Strong YTD operational performance,…
Executing on Achieving Scale Doubling our assets and EBITDA requires relentless focus on the following strategies Maximize Asset Greenfield Acquisitions Asset Value Expansion Development Haynesville Expansion Project Strong YTD…
Partnership Overview
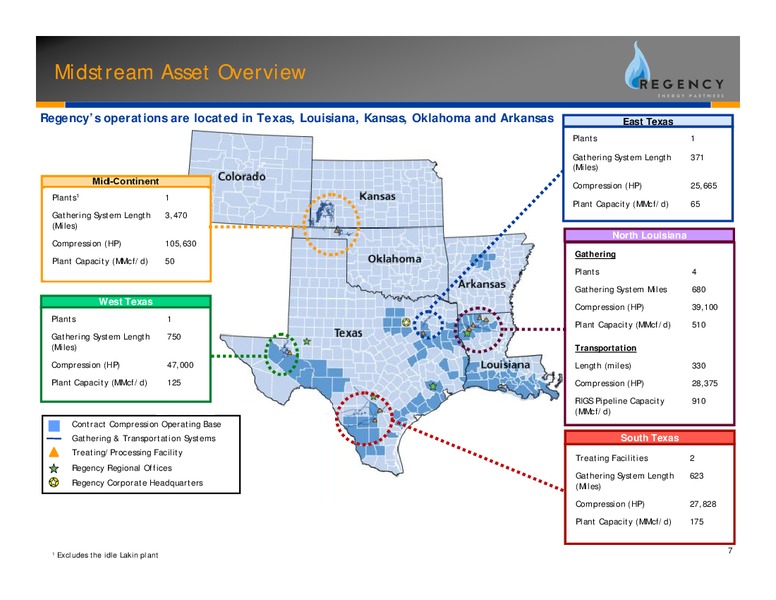
Midstream Asset Overview Regencys operations are located in Texas, Louisiana, Kansas, Oklahoma and Arkansas East East Texas Texas Plants 1 Gathering System Length 371 (Miles) Compression (HP) 25,665 Plants1 1 Plant Capacity…
Contract Compression Asset Overview Core compression operations are located in Texas, Louisiana and Arkansas HP by Region1 Total State HP Southwest 31% Southeast 16% Northwest 17% Northeast 36% HP by Size HP Total % of of…
Contract Compression Horsepower Growth Contract Compression has seen impressive year-over-year growth in horsepower 700,000 600,000 % 8.6 New R3 CAG Customer Horsepower 500,000 323,510 Growth 400,000 Growth in…
Haynesville Expansion
Project Overview: Description and Map Regency is significantly expanding its RIGS system to capitalize upon development in the Haynesville Shale f Project will add incremental 1.45 Bcf/d of capacity by constructing 204 miles of…
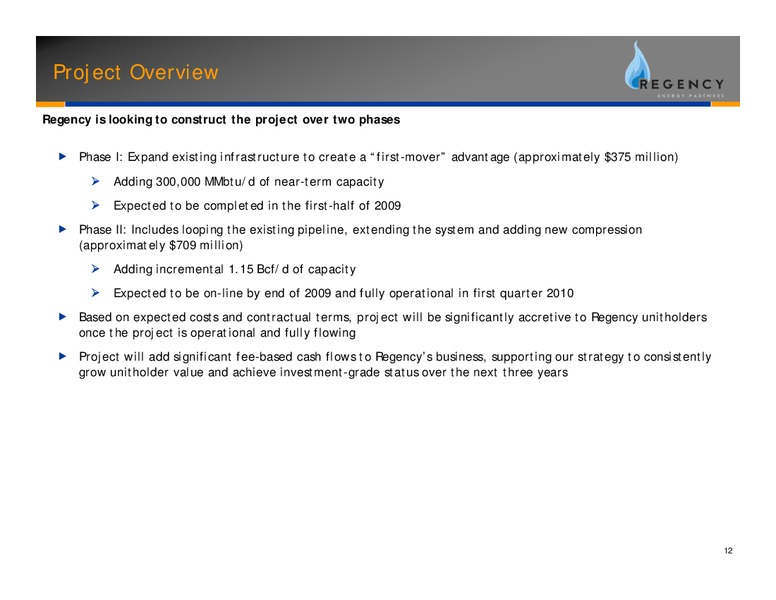
Project Overview Regency is looking to construct the project over two phases f Phase I: Expand existing infrastructure to create a first-mover advantage (approximately 375 million) Adding 300,000 MMbtu/d of near-term capacity…
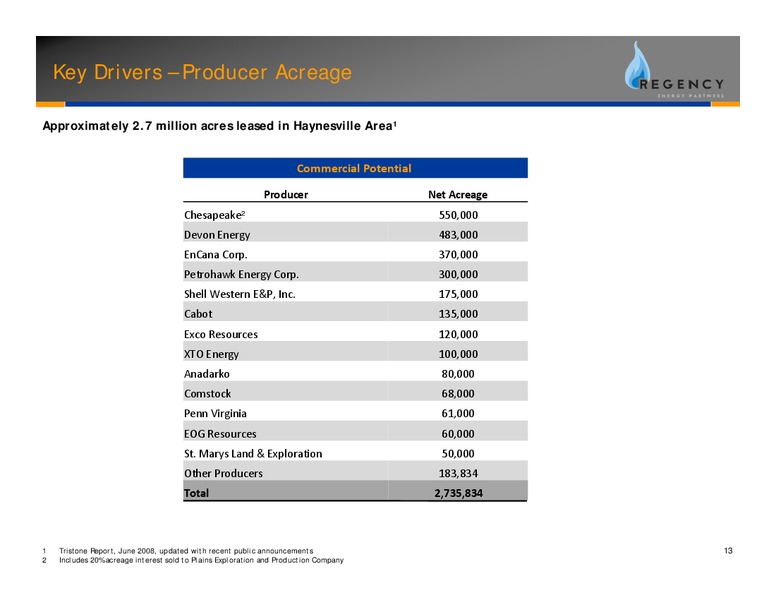
Key Drivers Producer Acreage Approximately 2.7 million acres leased in Haynesville Area Commercial Potential Producer Net Acreage Chesapeake 550,000 Devon Energy 483,000 EnCana Corp. 370,000 Petrohawk Energy Corp. 300,000…
Key Drivers Production Results Total play forecasted to peak at 4.0 Bcf/d by end of 2014 Company Well Information Headline First two wells have initial production rates of 16.8 and 16.7 Mmcfd 2 wells completed Petrohawk Expects to…
Overview of Project Costs Total cost of the project is projected to be 1.1 billion Expected Cost Project Description ( millions) Phase I Approximately 63 miles Pipeline/Interconnects 294 of 24 and 36 pipeline Compression…
Project Overview - Key Components of Cost These four areas represent approximately 90% of the baseline costs of the project; and 630 million (or 75% of the baseline cost) is based on firm rates via LOIs or Purchase Orders Construction…
Project Overview - Strategic Rationale The RIGS Haynesville expansion project meets all criteria of our stated strategy: Mission Key Objective Provide consistent growth in unit holder value Implications X Obtain scale in our…
Project Overview - Strategic Rationale On Target Obtain Scale through Greenfield Development Performance Management: f Realize synergies across business segments and f A performance incentive program will be developed regions to…
Commercial Overview - Intrastate Markets Project will provide ability to serve new intrastate markets Honeywell UOP Customer Name Location Plant Arsenal Hill & Smurfit Stone Hodge, LA AEP Stall Unit Weyerhaeuser Paper…
Commercial Overview - Pipeline Interconnects Regency currently has five major interconnects: Texas Gas, Trunkline, ANR, Tennessee and Columbia Gulf COLUMBI A f Current available interconnect capacity is 1.6 Bcf/d f Expect to…
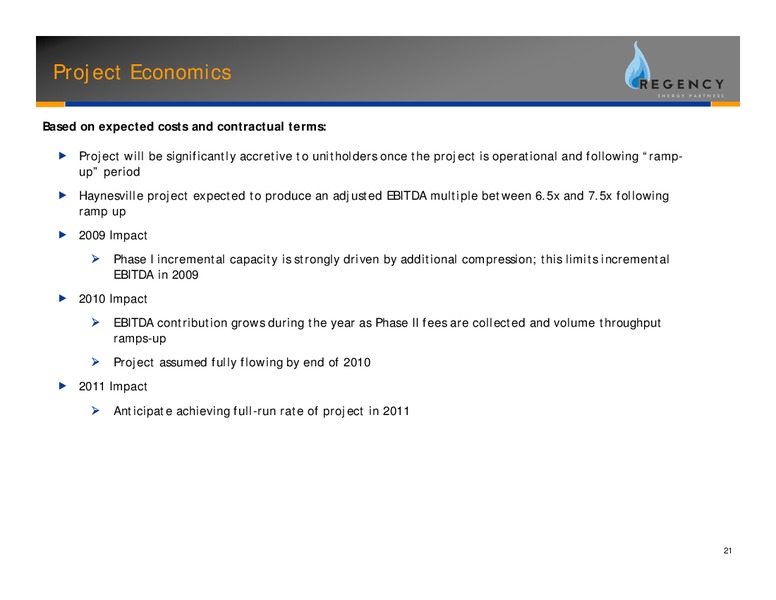
Project Economics Based on expected costs and contractual terms: f Project will be significantly accretive to unitholders once the project is operational and following ramp- up period f Haynesville project expected to produce an…
Upside/Other Benefits Potential upsides exist related to the project, including: f Design allows for an additional 250 MMcf/d of capacity at a cost of about 100 MM, if supported by additional demand f Pipeline completed earlier and…
Financing f Regency has obtained commitments from UBS Investment Bank, Morgan Stanley Senior Funding, Inc. and RBS Greenwich Capital for approximately 600 million in debt financing needs associated with project Funds will initially…
Financial Overview
Financial Performance Total Revenue Adjusted Total Segment Margin 1,400 1,190 250 229 1,200 212 897 952 200 1,000 in millions in millions 154 800 150 600 100 400 50 200 0 0 2006 2007 2008 YTD 2006 2007 2008 YTD…
Attractive Cash Flow Characteristics With the acquisition of Hugoton, CDM, and Nexus, a significantly larger portion of Regencys total segment margin is derived from fee-based business Total Segment Margin Q4 2007 Q2 2008 58%…
Distribution Growth Since the GE EFS investment, Regency has increased its quarterly distribution every quarter and has more than doubled its EBITDA Distribution History Initial GE EFS Investment % on CAGR 18.4 Distributi…
Non-GAAP Reconciliations
Non-GAAP Reconciliation Non-GAAP Adjusted Segment Margin to GAAP Net Income (Loss) Three Months Ended ( in thousands) June 30, 2008 Net income (loss) 9,972 Add: Operation and maintenance 32,516 General and administrative 13,925…
Non-GAAP Reconciliation Non-GAAP Adjusted Segment Margin to GAAP Net Income (Loss) Year to Date Dec. 31, Year to Date ( in thousands) 2006 2007 June 30, 2008 Net income (loss) (7,244) (13,836) 20,320 Add / (deduct): Operation and…
Non-GAAP Reconciliation Year to Date Dec. 31, Year to Date ( in thousands) 2006 2007 June 30, 2008 Net income (loss) (7,244) (13,836) 20,320 Income tax expense - 931 209 Interest expense, net 37,182 52,016 32,188 Depreciation…
Non-GAAP Reconciliation Non-GAAP Adjusted EBITDA to GAAP Net income (Loss) Three Months Ended Three Months Ended Three Months Ended Three Months Ended March 31, 2006 June 30, 2006 September 30, 2006 December 31, 2006 ( in thousands)…
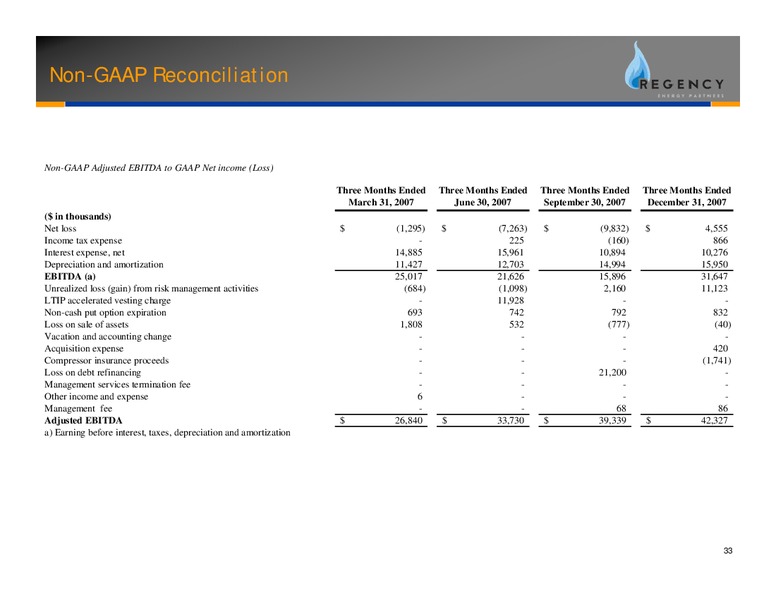
Non-GAAP Reconciliation Non-GAAP Adjusted EBITDA to GAAP Net income (Loss) Three Months Ended Three Months Ended Three Months Ended Three Months Ended March 31, 2007 June 30, 2007 September 30, 2007 December 31, 2007 ( in…
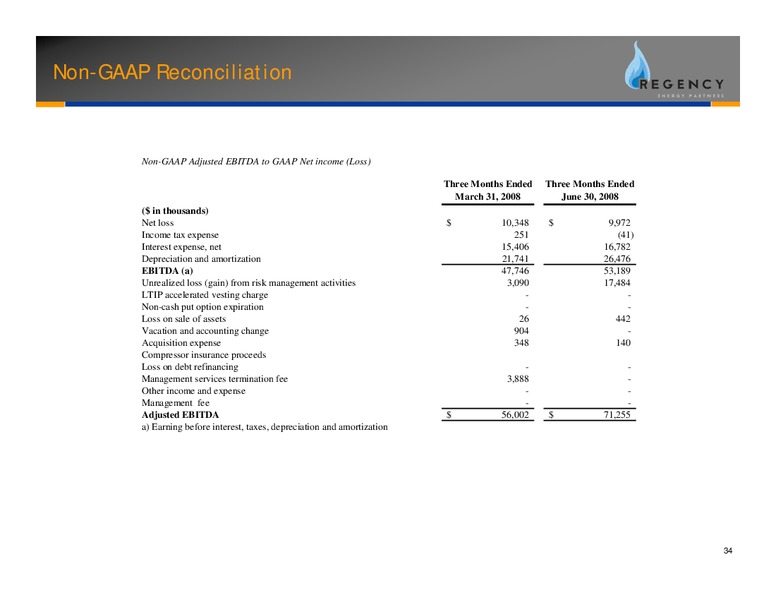
Non-GAAP Reconciliation Non-GAAP Adjusted EBITDA to GAAP Net income (Loss) Three Months Ended Three Months Ended March 31, 2008 June 30, 2008 ( in thousands) Net loss 10,348 9,972 Income tax expense 251 (41) Interest expense,…
 Loading...