I. Second Quarter 2008 Group Figures Financial Highlights Business Segment Figures and Financial Highlights Income Statement Balance Sheet as of June 30, 2008 First Half 2008 Net Cash Flow Statement First Half 2008 Subsea ROCE…
Second Quarter 2008 Group Financial Highlights in millions, except EPS 2Q07 2Q08 Change ex. FX impact Revenue 1,844.6 1,823.7 (1.1)% +6.1% EBITDA(1) 163.5 195.3 +19.4% +23.9% EBITDA margin 8.9% 10.7% 184bp Operating Income(2) 128.1…
Subsea Financial Highlights Revenue stable Revenue recognition on Agbami slipped, while MA-D6 provided good input Strong operating income Good project execution remains key Successful completion of a few projects Backlog…
Offshore Financial Highlights Revenue declined 12.9% year-on-year as expected Lower contribution from Akpo FPSO in second quarter 2008 and completion of Dalia FPSO in June 2007 Operating margin increased from 4.9% to 5.6%…
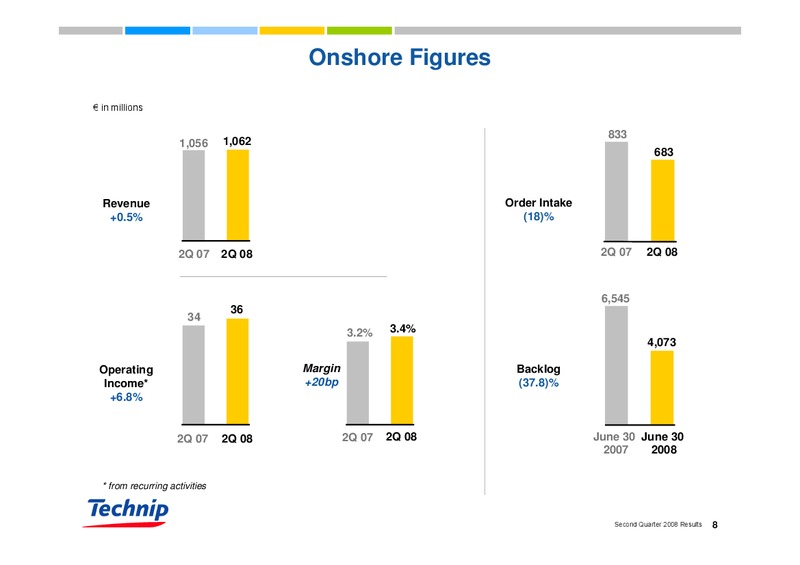
Onshore Financial Highlights Revenue stable compared to last year As major EPC lumpsum contracts are executed Operating margin continues to improve Our de-risking strategy on new projects has started to produce results Large…
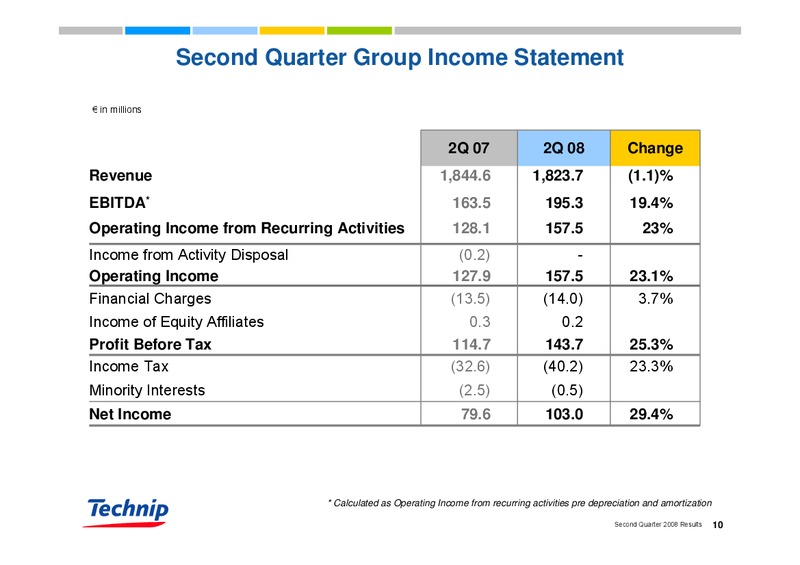
Second Quarter Group Income Statement in millions 2Q 07 2Q 08 Change Revenue 1,844.6 1,823.7 (1.1)% EBITDA* 163.5 195.3 19.4% Operating Income from Recurring Activities 128.1 157.5 23% Income from Activity Disposal (0.2) -…
Group Balance Sheet in millions Dec. 31, 2007 June 30, 2008 FIXED ASSETS 3,279.1 3,319.5 OTHER ASSETS 2,418.7 2,452.2 CASH & CASH EQUIVALENTS 2,401.5 2,155.8 TOTAL ASSETS 8,099.3 7,927.5 SHAREHOLDERS EQUITY (incl. min.…
First Half 2008 in millions Net Cash Flow Statement Net Cash as of December 31, 2007 1,704.3 Operating Cash Flow 268.9 Capex (147.8) Working Capital (172.3) Dividends payment (125.1) Others (62.1) Net Cash as of June 30, 2008…
First Half 2008 Subsea Return on Capital Employed in millions SUBSEA OTHERS** GROUP 2006 2007 1H 08 2006 2007 1H 08 2006 2007 1H 08 Non Current Assets 2,701 2,763 2,840 698 701 674 3,399 3,464 3 514 Working Capital and (601)…
II. Second Quarter 2008 Operational Highlights Subsea Offshore Onshore Second Quarter 2008 Results 14
Subsea Operational Highlights Operations / Projects High vessel utilization rate of 82% Flexible pipe production units are working at full capacity Offshore Nigeria the Agbami field project was slowed down by security events which…
Offshore Operational Highlights Operations / Projects Perdido SPAR hull is currently being fitted in Texas and will be handed over to Shell in the coming weeks Akpo FPSO sailed away on June 26, 2008 from Korea and is expected in…
Onshore Operational Highlights Operations / Projects Discussions on QatarGas III & IV are progressing. Qatar LNG and Gas treatment projects are executed in-line with plan. QatarGas II first train, number 4, to be delivered at summer…
III. Backlog Analysis Second Quarter 2008 Results 18
More Balanced Backlog: Segments and Markets Business Segment Split Market Split Other Petrochems ONSHORE 71% 2% 7% Deepwater 68% 51% Refining / 35% Heavy Oil 18% 6% OFFSHORE 6% 7% 43% 23% 15% Gas / LNG 22% 26% Shallow…
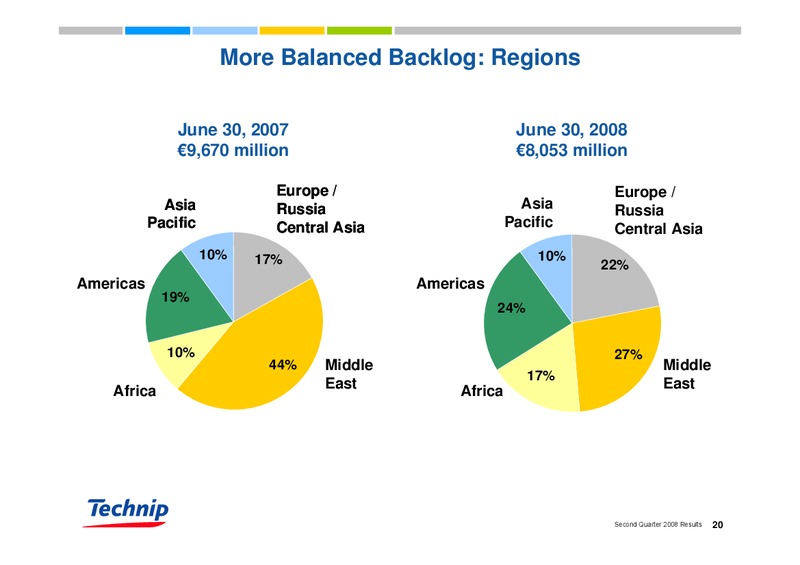
More Balanced Backlog: Regions June 30, 2007 June 30, 2008 9,670 million 8,053 million Europe / Europe / Asia Russia Asia Russia Pacific Central Asia Pacific Central Asia 10% 17% 10% 22% Americas Americas 19% 24% 10% 27%…
Backlog by Contract Award Date as of June 30, 2008 SUBSEA OFFSHORE ONSHORE 3,499 million 481 million 4,073 million 6% 8% 7% 4% 25% 34% 43% 25% 49% 56% 14% 29% < 2005 2005 2006 2007 1H 2008 Second Quarter 2008…
IV. Capex Status Major Capex progress as of June 30, 2008 2007 2010 Investment Program Update Second Quarter 2008 Results 22
Major Capex Progress as of June 30, 2008 17% Physical Progress ASIA FLEX Malaysia 6% Payment Progress (Current accounting method) 25% PLSV Brazil 10% 22% NPV Worldwide 21% 60% SKANDI ARCTIC Norway 34% 0% 10% 20%…
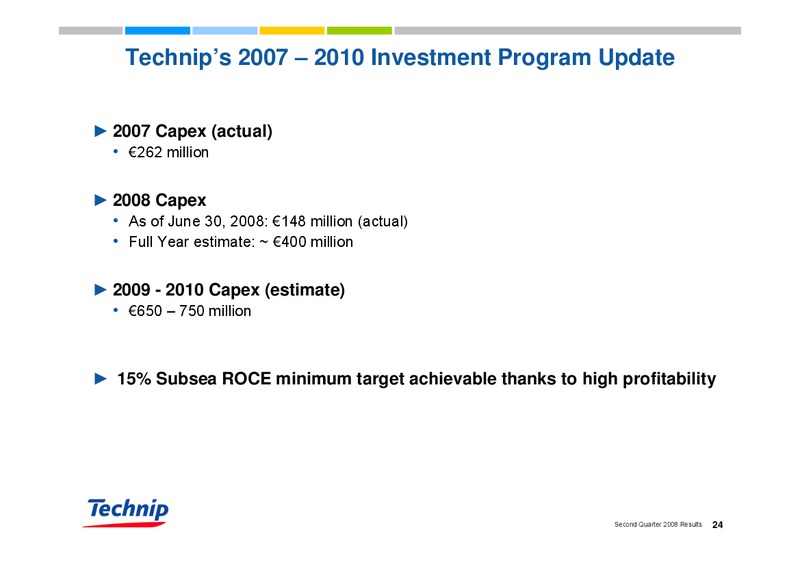
Technips 2007 2010 Investment Program Update 2007 Capex (actual) 262 million 2008 Capex As of June 30, 2008: 148 million (actual) Full Year estimate: 400 million 2009 - 2010 Capex (estimate) 650 750 million 15% Subsea ROCE…
V. M&A Activity Second Quarter 2008 Results 25
Second Quarter 2008 M&A Activity Technology driven acquisition: Market position driven acquisition: EURODIM EPG Eurodim, based in France, holds numerous EPG, based in The Netherlands, reinforces patents and provides innovative…
V. 2008 Outlook Second Quarter 2008 Results 27
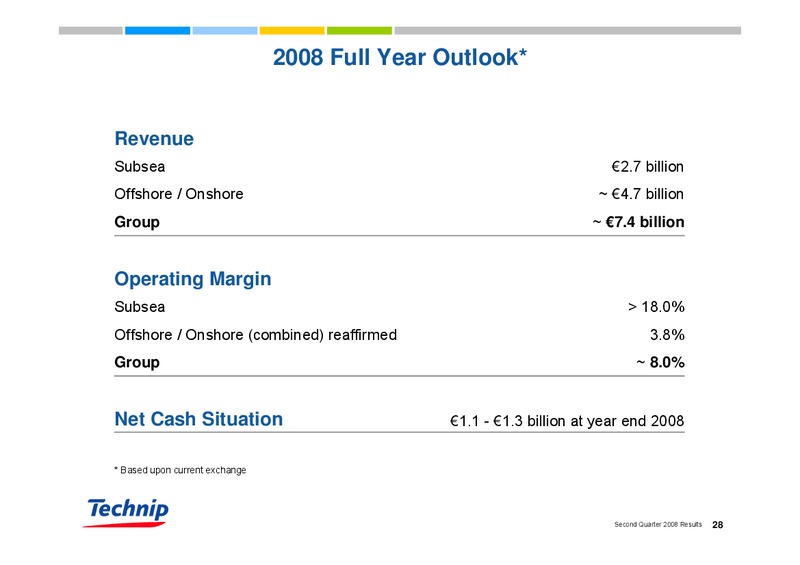
2008 Full Year Outlook* Revenue Subsea 2.7 billion Offshore / Onshore 4.7 billion Group 7.4 billion Operating Margin Subsea 18.0% Offshore / Onshore (combined) reaffirmed 3.8% Group 8.0% Net Cash Situation 1.1 - 1.3 billion at year…
Second Quarter 2008 Conclusion Solid Subsea performance EBITDA margin: 24.8% Operating margin: 19.7% Offshore and Onshore on track Combined operating margin: 3.7% Backlog balanced per segment, region and market Business…
For more information, please contact: INVESTOR RELATIONS Kimberly Stewart Tel. +33 (0)1 47 78 66 74 e-mail: kstewarttechnip.com Antoine dAnjou Tel. +33 (0)1 47 78 30 18 e-mail: adanjoutechnip.com Second Quarter 2008…
Trading Technip ISIN: FR0000131708 Second Quarter 2008 Results 32
Annex: June 30, 2008 Backlog Estimated Scheduling in millions Subsea Offshore Onshore Group 2H 2008 1,436 265 1,899 3,600 2009 1,243 160 1,939 3,342 2010+ 820 56 235 1,111 Total 3,499 481 4,073 8,053 Second Quarter…
Annex: First Half Group Income Statement in millions, except EPS ex. FX 1H 07 1H 08 Change impact Revenue 3,619.3 3,640.5 0.6% 7.8% EBITDA* 307.3 366.2 19.2% 23.2% Operating Income from Recurring 236.0 294.4 24.7% 28.0% Activities…
Annex: First Half 2008 Business Segment Operating Performance in millions SUBSEA OFFSHORE ONSHORE Revenue 1,152.2 346.0 2,142.2 Change (2.6)% (14.7)% +5.5% Operating Income from recurring activities 216.8 18.6 69.3 Change…
 Loading...