Regency Energy Partners LP Barclays Capital Fixed Income Energy & Pipeline Conference March 25, 2009
Managing Through Challenging Times f Mission and Objectives f Haynesville Joint Venture Overview f Haynesville Expansion Project Overview f Solid Foundation of Assets f Strong Fee-Based Margin f Summary 2
Mission And Objectives
Looking Back - 2008 to Present 2008 Represented a Year of Two Journeys Accomplishments Through October Accomplishments October Through Present Announced and integrated three major acquisitions valued at 936 million R…
Near Term - 2009 and 2010 Key Objectives Key Objectives f Reduced our growth capital budgets to 120 million in 2009 and 100 million in 2010 Reduce our dependence on capital markets f Secured financing through Joint Venture to…
Long Term Mission and Key Objective Mission Key Objective Consistent growth in unit holder Provide consistent value Achieve investment growth in unit grade status holder value Implications X Obtain scale in our business…
Haynesville Joint Venture Overview
Joint Venture Structure Regency Management is forming a partnership with select investors to co- develop the Haynesville Expansion Project JV Ownership % RIGS1 38% Regency 400 million contribution value on) on Alinda…
Transaction Overview Transaction Details f Regency Haynesville Intrastate Gas LLC, a subsidiary of Regency Energy Partners LP Parties f General Electric Capital Corporation, an affiliate of GE Energy Financial Services (GE EFS) f…
Current Transportation (RIGS) Asset Overview Regency will contribute the Regency Intrastate Gas System (RIGS), a 320-mile pipeline, to the Joint Venture, valued at approximately 400 million RIGS Details f Petrohawk f Exco f Union…
Joint Venture Benefits By partnering with GE EFS and Alinda, Regency has secured financing for the Haynesville Expansion Project under terms accretive to our unitholders in 2010 and beyond Key y Highlights g g f Allows Regency to…
Haynesville Expansion Project
Overview of Haynesville Expansion Project Regency is significantly expanding RIGS to capitalize on development in the Haynesville Shale f Project adds incremental 1.1 Bcf/d capacity to existing RIGS system f Currently, 84% or 925…
Commercial Update - Haynesville Production Results Company Headlines Estimated Ultimate Recovery (EUR) of 7.5 Bcfe per well Recently announced IP results on six new wells averaging 14.5 MMcfe/d, including two wells that experienced…
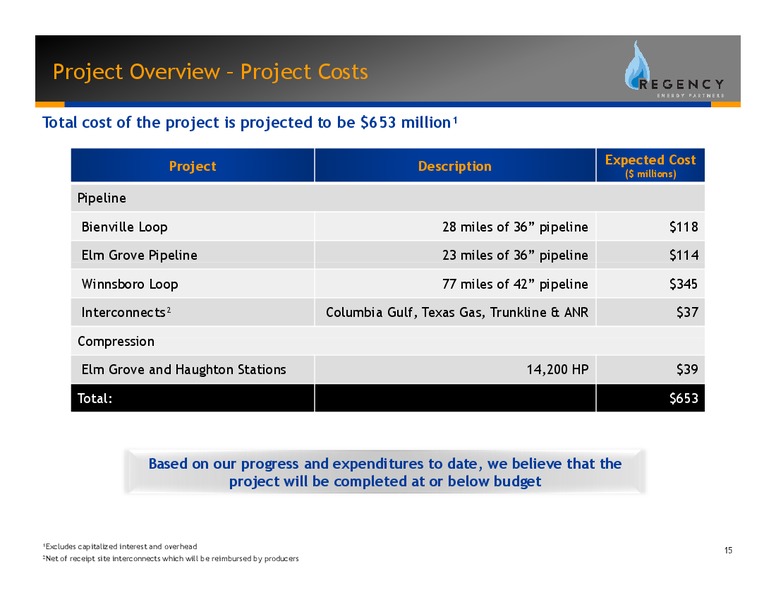
Project Overview Project Costs Total cost of the project is projected to be 653 million Project Description Expected Cost ( millions) Pipeline Bienville Loop 28 miles of 36 pipeline 118 Elm Grove Pipeline p 23 miles of 36 p…
Construction Update - Timeline Approximate Project Construction Timeline Aug08 Sep08 Oct08 Nov08 Dec08 Jan09 Feb09 Mar09 Apr09 May09 Jun09 Jul09 Aug09 Sep09 Oct09 Nov09 Dec09 Survey Environmental Permits LA Department of Natural…
Solid Foundation of Assets
Midstream Overview Gathering & Processing Overview Regencys midstream operations are primarily located in Texas, Louisiana, Oklahoma and Kansas1 East Texas Mid-Continent Plants 1 Plants 1 Gathering System Length 371 Gathering…
Solid Foundation - Contract Compression Asset Overview Core compression operations are located in Texas, Louisiana and Arkansas HP by Region1 State Total HP of Units Southwest (TX) 213,802 281 Southeast (LA & TX) 120,835 137…
Strong Fee Fee-Based Based Margin
Solid Foundation - Changing Business Mix Growing our fee-based transportation and contract compression businesses 500 Adjusted Segment Margin 450 Adjusted Segment Margin 441 400 350 300 millions 250 229 in m 200…
Commodity Price Risk Management Based on Regencys contract mix we are a net seller of both liquids and natural gas, and on a portfolio basis Regency has no net keep whole exposure Only 3% of Regencys estimated 2009 Adjusted Segment…
Commodity Price Risk Management Regencys executed hedge pricing increases in 2010, which translates into built-in growth in adjusted segment margin Executed Hedges by Product: 2009 2010 Bbl/d Price Bbl/d Price Ethane 1 920…
Summary
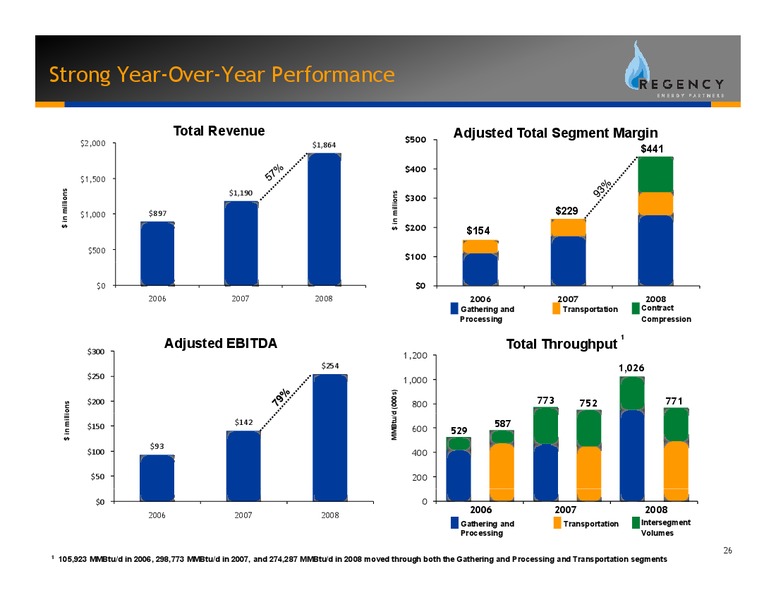
Strong Year-Over-Year Performance Total Revenue Adjusted Total Segment Margin 2,000 500 1,864 441 400 1,500 in millions 1,190 in millions 300 1,000 897 229 200 154 500 100 0 0 2006 2007 2008 2006 2007 2008…
Managing Through Challenging Times With the higher cost of capital our sector is facing, Regency has prudently adapted with a focus on maintaining a solid balance sheet O Optimizing our strong ffoundation d off assets Reduced…
Question & Answers
Non-GAAP Non GAAP Reconciliations
Non-GAAP Reconciliation Reconciliation of Non-GAAP Measures to GAAP Measure Year to Date December 31, ( in thousands) 2008 2007 2006 Net income (loss) 101,016 (13,836) (7,244) Income tax expense (benefit) (266) 931 - Interest…
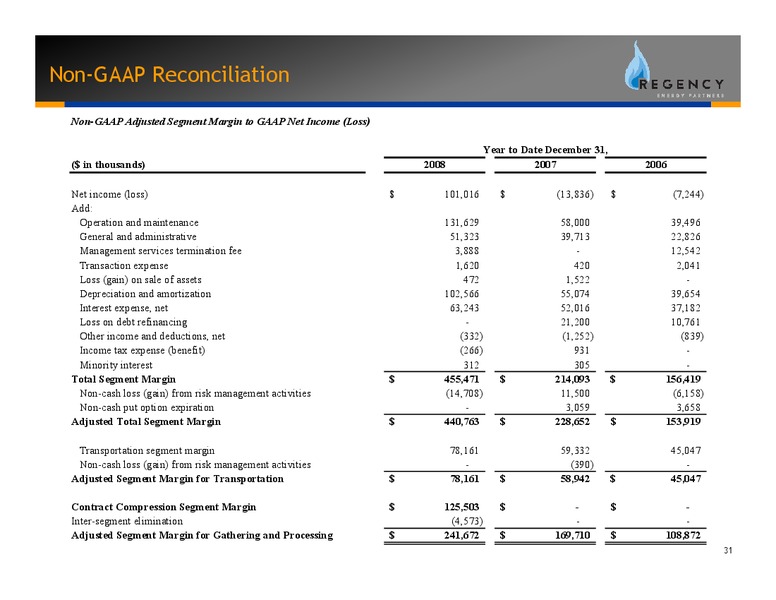
Non-GAAP Reconciliation Non-GAAP Adjusted Segment Margin to GAAP Net Income (Loss) Year to Date December 31, ( in thousands) 2008 2007 2006 Net income (loss) 101,016 (13,836) (7,244) Add: Operation and maintenance 131,629 58,000…
 Loading...