OMV Aktiengesellschaft OMV Results January December and Q4 2011 Gerhard Roiss, Chairman of the Executive Board and CEO David C. Davies, Deputy Chairman of the Executive Board and CFO Jaap Huijskes, Executive Board member…
Strong performance in a challenging year New strategy Profitable Growth launched in September 2011 Successful closing of two large capital market transactions (EUR 1.5 bn) Lost-time injury rate in Petrom reduced by 50% within 3 years…
Strong financial performance in 2011 (1) Clean CCS EBIT up 2% to EUR 2,509 mn Clean CCS EBIT, EUR mn E&P: Production at 288 kboe/d, down by 9% due to political 2,509 +2% instability in Libya and Yemen 2,470 225 232 Romanian…
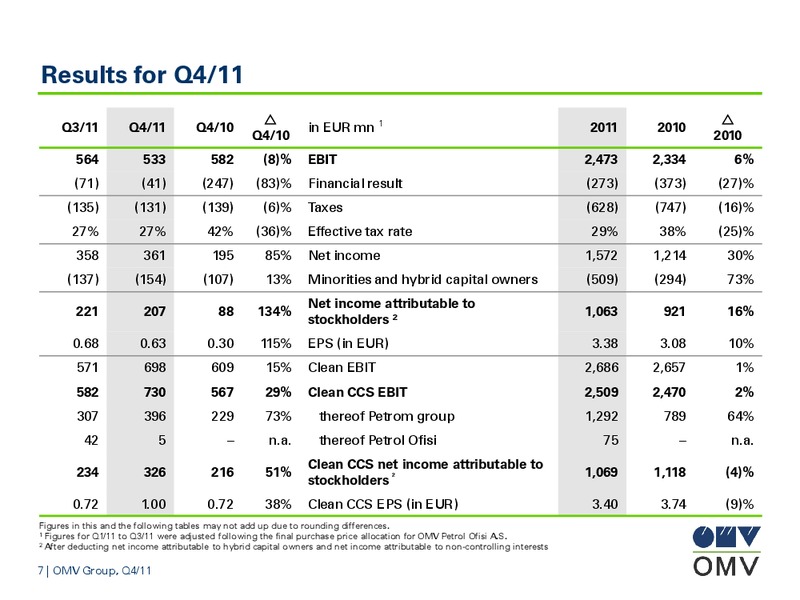
Strong financial performance in 2011 (2) At a glance Clean CCS EBIT up 2% to EUR 2,509 mn (2010: EUR 2,470 mn) Net income 1 up by 30% to EUR 1,572 mn (2010: EUR 1,214 mn) Cash flow from operating activities down to EUR 2,514 mn…
OMV Aktiengesellschaft Results Q4/11 Move & More.
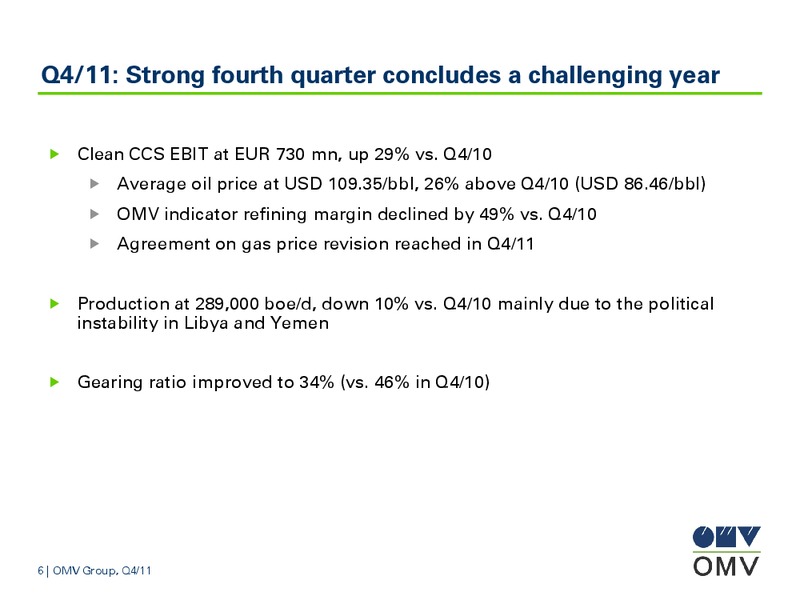
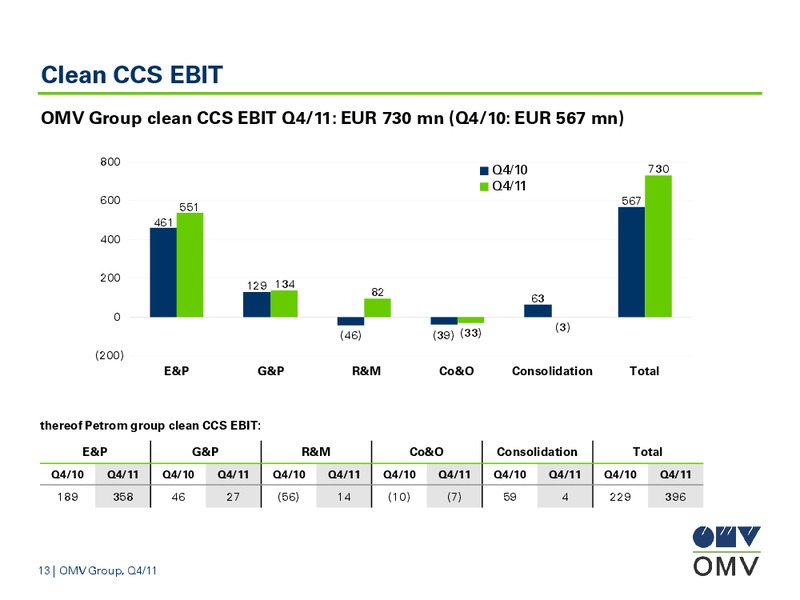
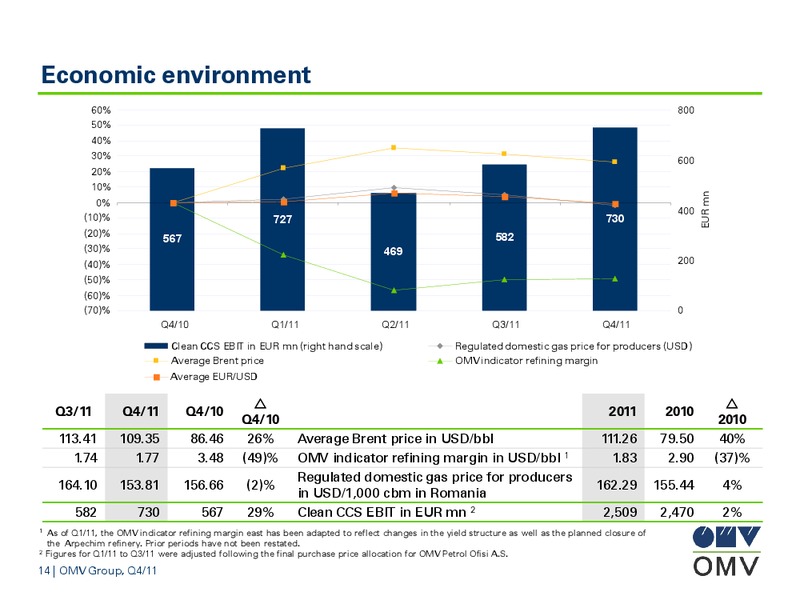
Q4/11: Strong fourth quarter concludes a challenging year Clean CCS EBIT at EUR 730 mn, up 29% vs. Q4/10 Average oil price at USD 109.35/bbl, 26% above Q4/10 (USD 86.46/bbl) OMV indicator refining margin declined by 49% vs. Q4/10…
Cash flow Q3/11 Q4/11 Q4/10 in EUR mn 1 2011 2010 Q4/10 2010 358 361 195 85% Net income 1,572 1,214 30% 394 418 375 12% Depreciation and amortisation 1,626 1,578 3% 3 (11) 299 n.m. Other (152) 182 n.m. 756 768 869 (12)%…
Gearing ratio development 60 50 46 47 40 34 33 34 in % 30 20 Gearing ratio (net debt / equity) 10 Gearing ratio target 30% 0 Q4/10 Q1/11 Q2/11 Q3/11 Q4/11 Maintaining a strong investment grade credit rating…
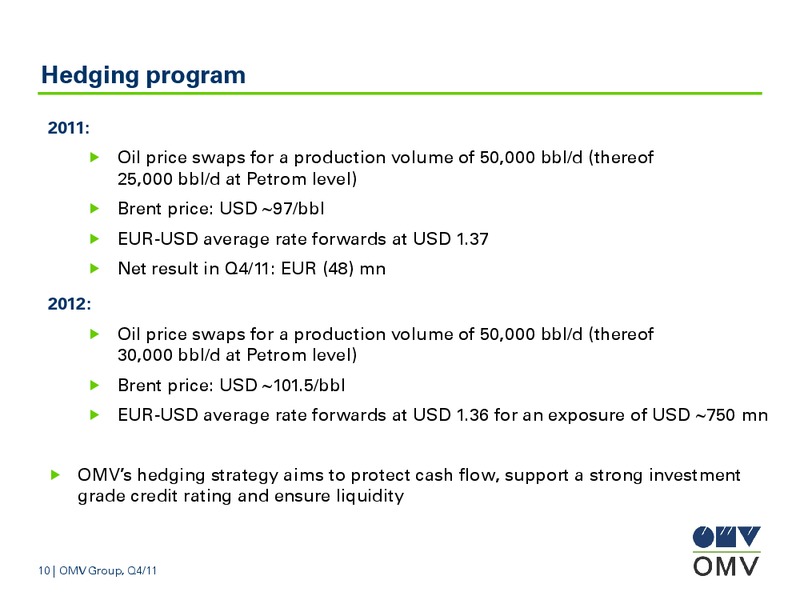
Hedging program 2011: Oil price swaps for a production volume of 50,000 bbl/d (thereof 25,000 bbl/d at Petrom level) Brent price: USD 97/bbl EUR-USD average rate forwards at USD 1.37 Net result in Q4/11: EUR (48) mn 2012: Oil…
Group E&P: Restart of production in Libya, but production suspended again in Yemen Production up by 2% vs. Q3/11 mainly due to the partial resumption of production in Libya and increased production in the UK and Romania Q4/11 clean…
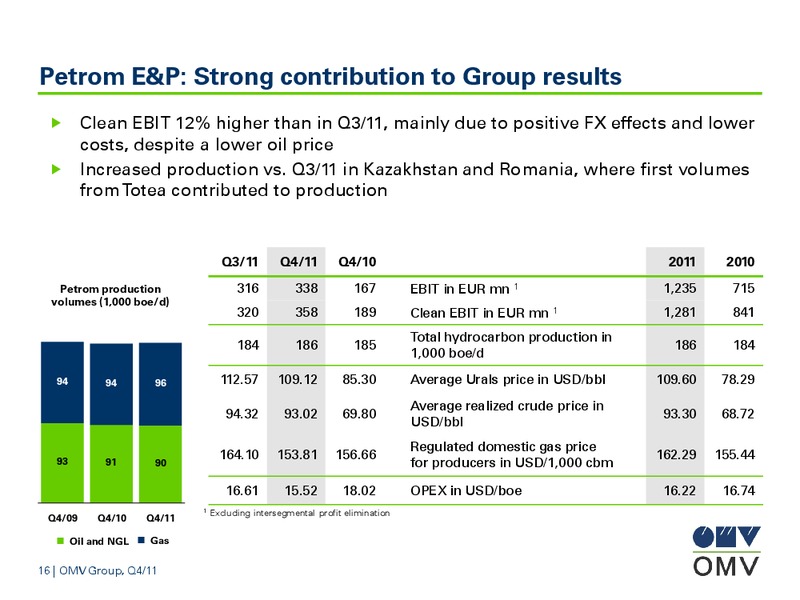
Petrom E&P: Strong contribution to Group results Clean EBIT 12% higher than in Q3/11, mainly due to positive FX effects and lower costs, despite a lower oil price Increased production vs. Q3/11 in Kazakhstan and Romania, where first…
Exploration activities Update Norway: Austria: Kurdistan Region of Iraq: Zidane discovery: 20% stake acquired late Mistelbach 3D seismic: Bina Bawi-3: Testing finalized; December; Zidane-2 exploration well spudded 40% of 325km acquired…
Project activities Update UK, West of Shetland: Romania: Schiehallion redevelopment: FID Totea: Discovered in July 2011, tied-in in taken in July, detailed design and October 2011, appraisal well spudded in procurement process (i.e.…
Group R&M: Improved clean CCS result in spite of difficult economic environment Improved cost position and operational performance more than offset lower OMV indicator refining margin as a result of a higher oil price in Q4/11 vs.…
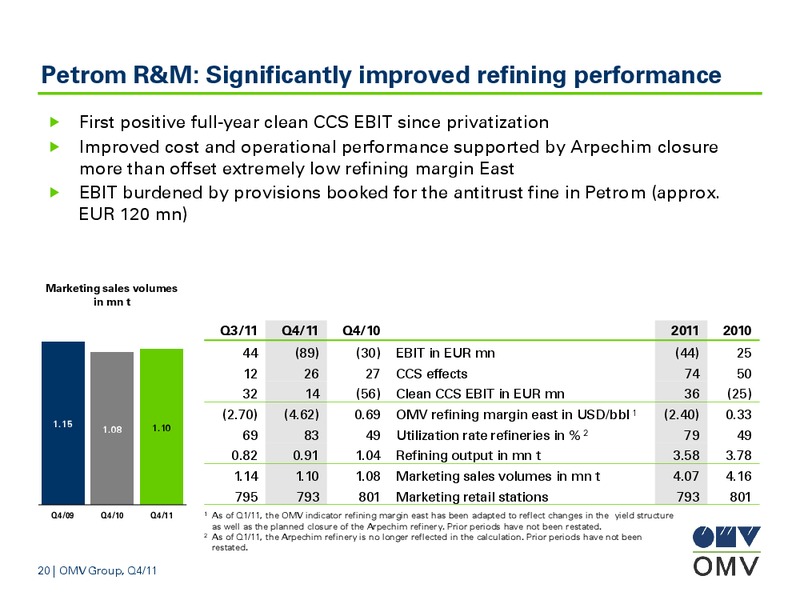
Petrom R&M: Significantly improved refining performance First positive full-year clean CCS EBIT since privatization Improved cost and operational performance supported by Arpechim closure more than offset extremely low refining margin…
Petrol Ofisi R&M: Industry retail margins under pressure in Q4/11 Market leader in white oil product sales with market share of 26% and step-up to leading position in lubricants business (market share: 24%) Industry retail margins…
Group G&P: Favorable price revision partially offset margin pressure Successful negotiations on price revision partially offset strong pressure on EconGas margins Gas transportation business reported higher volumes vs. Q4/10 due to…
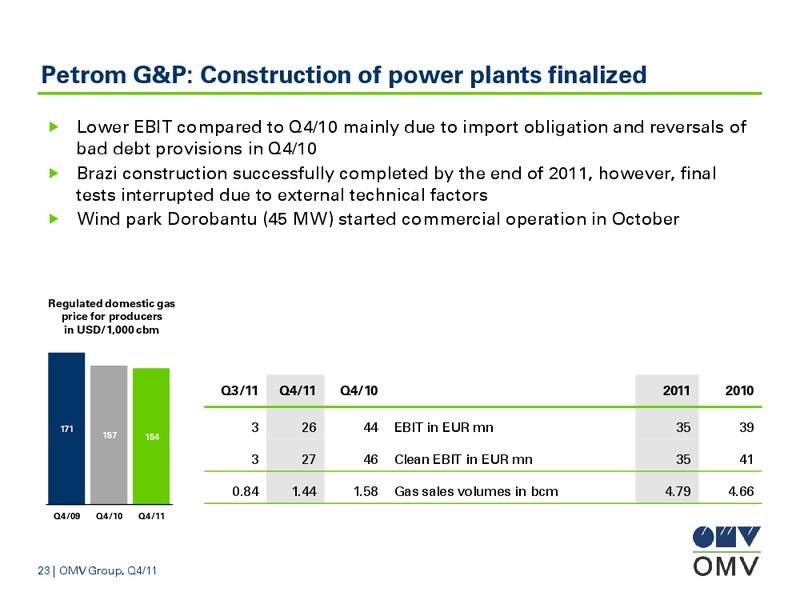
Petrom G&P: Construction of power plants finalized Lower EBIT compared to Q4/10 mainly due to import obligation and reversals of bad debt provisions in Q4/10 Brazi construction successfully completed by the end of 2011, however,…
Outlook 2012 Roll-out of the group-wide performance program energize OMV Net CAPEX 2012 to be in line with the guidance of average annual net CAPEX of EUR 2.4 bn (excl. acquisitions) Continued focus on Health, Safety, Security and…
Strategy Profitable Growth: Main targets Stabilized production in Romania and Austria: 200-210 kboe/d until 2014 Production growth until 2016 1: 2% p.a. organic, up to 4% incl. acquisitions Access to upstream gas: Romania, Caspian…
 Loading...