Regency Energy Partners Third Quarter Earnings Release November 9, 9 2009
Year-To-Date Highlights Key Accomplishments Year-To-Date for 2009 Despite continued low rig counts and weakness in commodity pricing, Regency has produced three solid quarters of performance with a year-to-date combined adjusted…
Third Quarter Highlights Achieved 55 million of adjusted EBITDA despite the Waha Plant turnaround project Despite record rainfall and minimal expected 2009 EBITDA contribution from the Haynesville Expansion Project, management expects…
Business Review
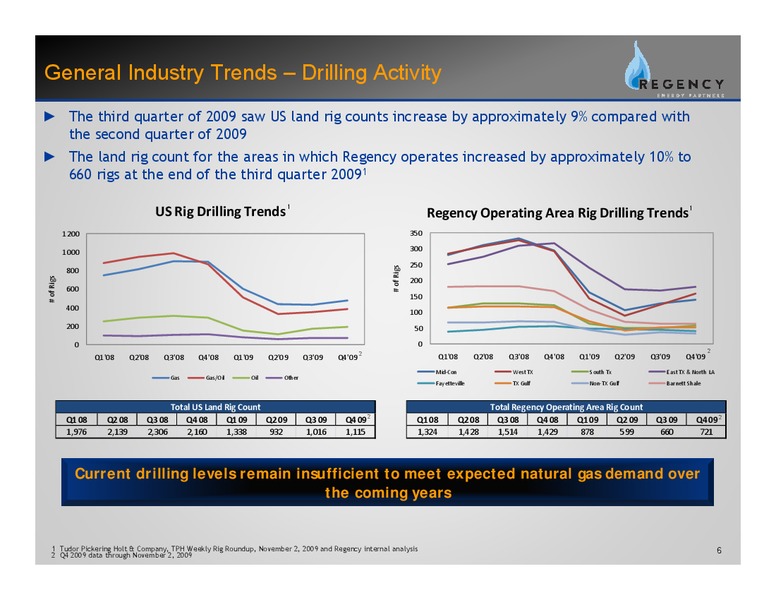
General Industry Trends Drilling Activity The h third h d quarter off 2009 saw USS lland d rig counts increase b by approximately l 9% compared d with h the second quarter of 2009 The land rig count for the areas in which…
General Industry Trends Commodity Prices Gas prices stabilized during the third quarter of 2009 WTI crude continued its rebound while NGL prices remained relatively flat during the third quarter Gas Price Trends Crude / NGL Price…
Majority Fee-Based Portfolio Fee-based cash flows represent a growing portion of Regencys Adjusted Segment Margin Only an estimated 2% of Adjusted Segment Margin will be subject to commodity price fluctuations in the balance of…
Volume Comparisons Adjusting for plant outages in both quarters, Transportation segment volumes were slightly third quarter underlying volumes in our down quarter-over-quarter largely due to Gathering & Processing segment were up…
Historical Horsepower Growth vs. US Rig Count Despite a 52% decline in the US onshore gas rig count since September 2008, Regencys revenue generating horsepower has remained flat over the same period Revenue Generating Horsepower…
Haynesville Shale and Joint Venture Update
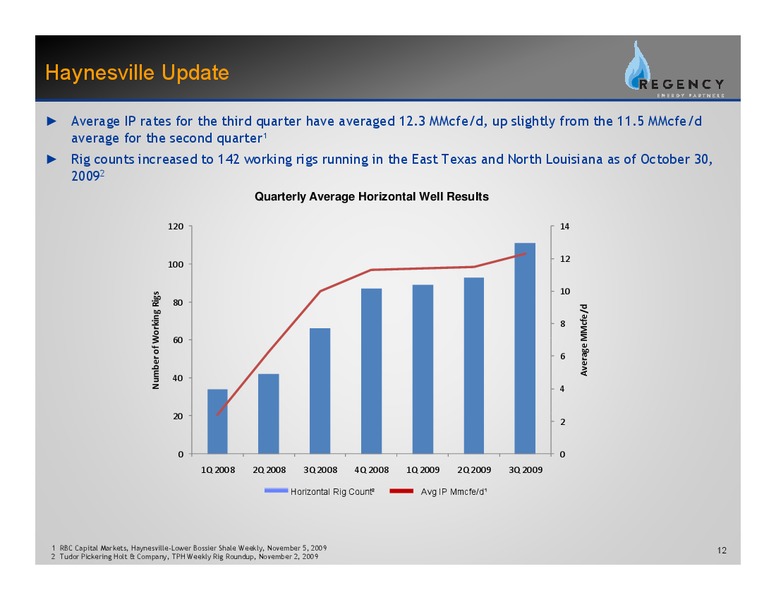
Haynesville Update Average IP rates for the third quarter have averaged 12.3 MMcfe/d, up slightly from the 11.5 MMcfe/d average for the second quarter Rig counts increased to 142 working rigs running in the East Texas and North…
Haynesville Joint Venture Partnership Structure Regency purchased an additional 5% ownership interest in the Joint Venture from an affiliate of GE Energy Financial Services on September 2, 2009, bringing Regencys total ownership to…
Haynesville Expansion Project Construction Update 36 Pipe Construction Elm Grove Line Bienville Loop Construction Commenced in May Commenced in May All bores and HDDs are complete All bores and HDDs are complete Road bores, HDDs and…
Overview of Red River Lateral1 R Regency is i constructing t ti the th 47 million illi R Red d Ri River LLateral, t l a pipeline i li extension t i tto iincrease capacity it on RIGS Adds approximately 100,000 MMBtu/d of…
Overview of Logansport Expansion1 Regency is constructing the 44 million Logansport Expansion, an extension of the Nexus Gathering System in North Louisiana Provides gathering customers with additional high-value takeaway options in…
Third Quarter 2009 Summary Third Quarter Summary Despite continued weakness in the overall natural gas industry and continued low rig counts Financials our third quarter results positioned us to be near the midpoint of our 2009 pro…
Financial Review
Consolidated Operating Results R Regency E Energy PPartners LP Condensed Consolidated Income Statements Unaudited ( in thousands) Three Months Ended September 30, 2009 June 30, 2009 March 31, 2009 REVENUES Gas sales 97,597…
Gathering and Processing Segment Three Months Ended September 30, 2009 June 30, 2009 March 31, 2009 ( in thousands) Gathering and Processing Segment Financial data (1)(2): S Segment margini 59,501 9 01 57,507 0 58,676 86 6…
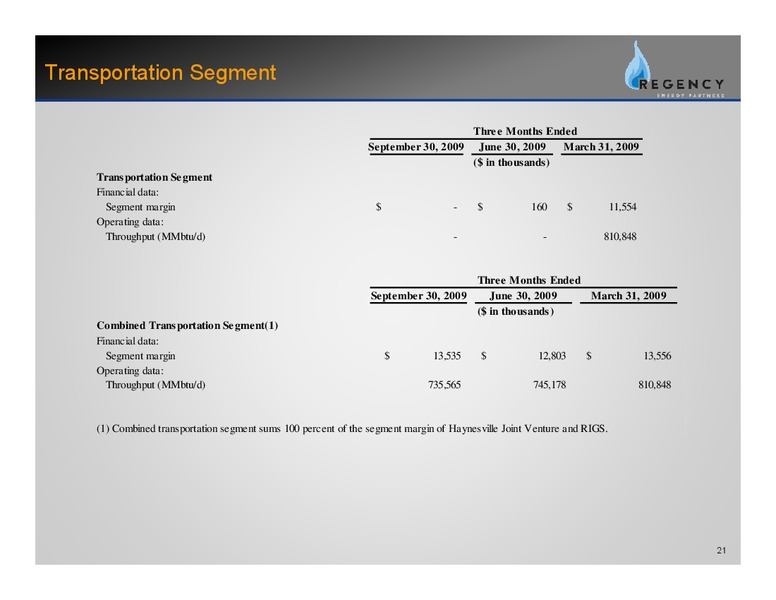
Transportation Segment Three Months Ended September 30, 2009 June 30, 2009 March 31, 2009 ( in thousands) Transportation Segment Financial data: Segment margin - 160 11,554 Operating data: Throughput (MMbtu/d) - - 810,848…
Contract Compression Segment Three Months Ended September 30, 2009 June 30, 2009 March 31, 2009 ( in thousands) Contract Compression Segment Financial data: Segment margin 34,085 35,800 36,980 Operating data: Revenue generating…
Commodity Price Risk Management Regency expects to execute additional hedges to bring our 2010 hedge percentages to approximately 85% of NGLs and Condensate and 75% of Natural Gas by year-end By year-end 2009, Regency expects to hedge…
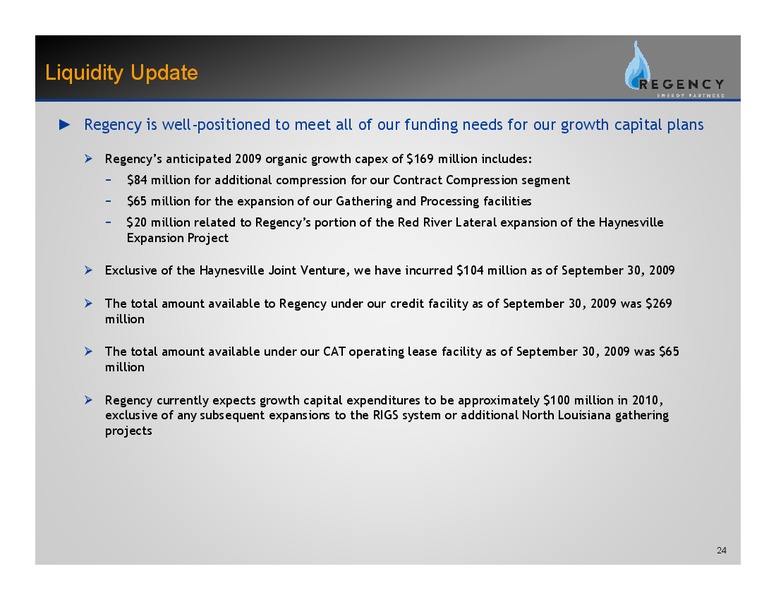
Liquidity Update Regency is well-positioned to meet all of our funding needs for our growth capital plans Regencys anticipated 2009 organic growth capex of 169 million includes: p 84 million for additional compression for our…
Q&A
Appendix Appendi
Consolidated Operating Results (Year-Over-Year) Regency Energy Partners LP Condensed Consolidated Income Statements Unaudited ( in thousands) Three Months Ended Nine Months Ended September 30, 2009 September 30, 2008 September 30,…
Gathering and Processing Segment (Year-Over-Year) Three Months Ended September 30, Nine Months Ended September 30, 2009 2008 2009 2008 ( in thousands) Gathering and Processing Segment Financial data (1): Segment margin 59,501…
Combined Transportation Segment (Year-Over-Year) Three Months Ended September 30, Nine Months Ended September 30, 2009 2008 2009 2008 ( in thousands) Transportation Segment Financial data (1): Segment margin - 16,667 11,714 50,904…
Contract Compression Segment (Year-Over-Year) Three Months Ended September 30, Nine Months Ended September 30, 2009 2008 2009 2008 ( in thousands) Contract Compression Segment Financial data: Segment margin (1) 34,085 39,288 106,865…
Non-GAAP Reconciliation Three Months Ended September 30, 2009 June 30, 2009 March 31, 2009 ( in thousands) Net (loss) income (10,543) 5,955 148,424 Income tax (benefit) expense (196) (515) 100 Interest expense, expense net 22 173…
Non-GAAP Reconciliation Three Months Ended September 30, 2009 June 30, 2009 March 31, 2009 ( in thousands) Net (loss) income (10,543) 5,955 148,424 Add (Deduct): Operation and maintenance 32,139 31,974 36,042 General and…
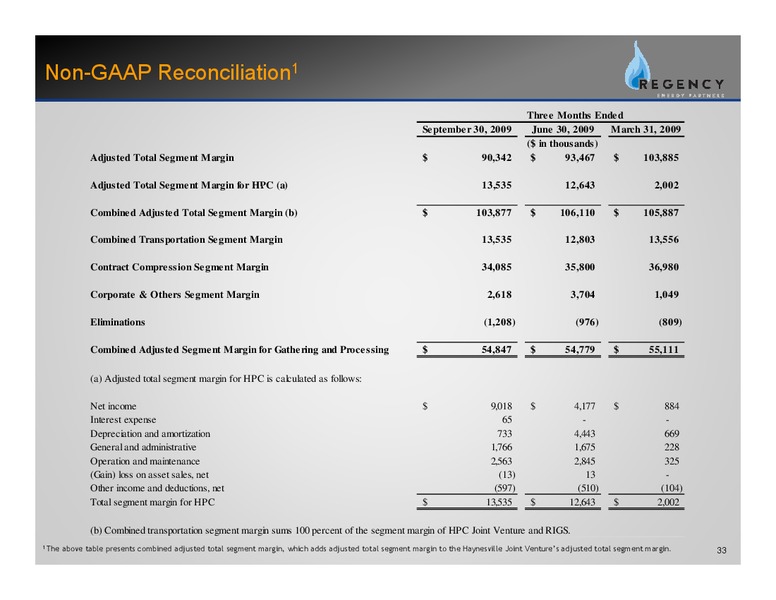
Non-GAAP Reconciliation1 Three Months Ended September 30, 2009 June 30, 2009 March 31, 2009 ( in thousands) Adjusted Total Segment Margin 90,342 93,467 103,885 Adjusted Total Segment Margin for HPC (a) 13 535 13,535 12 643 12,643…
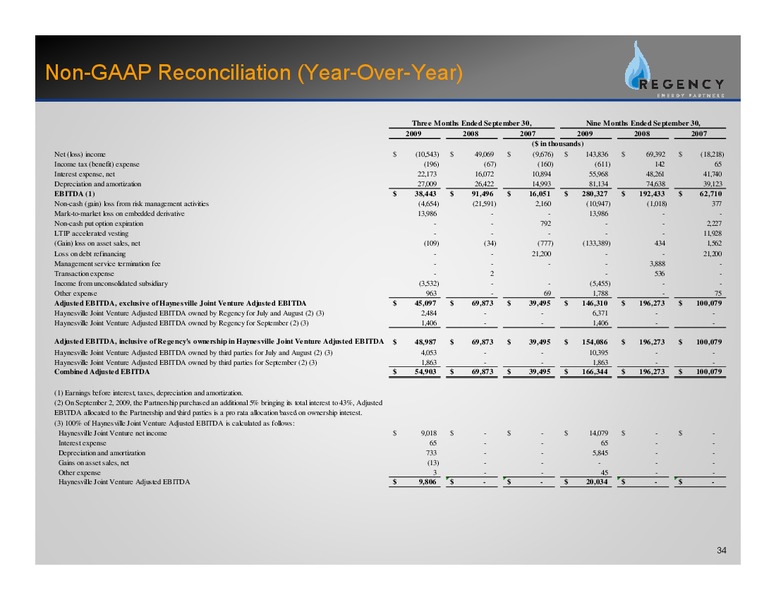
Non-GAAP Reconciliation (Year-Over-Year) Three Months Ended September 30, Nine Months Ended September 30, 2009 2008 2007 2009 2008 2007 ( in thousands) Net (loss) income (10,543) 49,069 (9,676) 143,836 69,392 (18,218) Income tax…
Non-GAAP Reconciliation (Year-Over-Year) Three Months Ended September 30, Nine Months Ended September 30, 2009 2008 2007 2009 2008 2007 ( in thousands) Net (loss) income (10,543) 49,069 (9,676) 143,836 69,392 (18,217) Add (Deduct):…
Non-GAAP Reconciliation (Year-Over-Year)1 Three Months Ended September 30, Nine Months Ended September 30, 2009 2008 2007 2009 2008 2007 ( in thousands) Adjusted Total Segment Margin 90,342 117,419 63,830 287,694 329,656 161,040…
Non-GAAP Reconciliation Three Months Ended September 30, 2009 ( in thousands) Net cash flows provided by operating activities 37,842 Add (deduct): Depreciation and amortization, including debt issuance cost amortization (28,916) N…
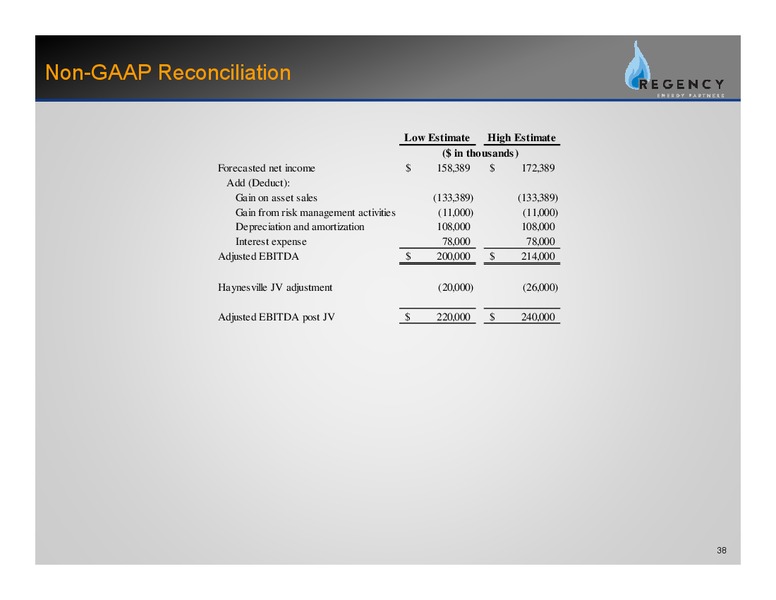
Non-GAAP Reconciliation Low Estimate High Estimate ( in thousands) Forecasted net income 158,389 172,389 Add ((Deduct):) Gain on asset sales (133,389) (133,389) Gain from risk management activities (11,000) (11,000) Depreciation…
 Loading...