Regency Energy Partners LP Oppenheimer Presentation September 13, 2012
Key Investment Highlights Integrated midstream portfolio with high percentage of fee-based margins High-quality asset base strategically located in critical supply basins Significant organic growth platform driven by liquids and…
Integrated Midstream Platform Regencys diverse portfolio of services generates solid results while offering complete midstream services to producers Natural Gas Services Residue Gas Utilities Residential Natural Gas Natural Gas…
Strategically Located Assets Drilling activity in liquids-rich plays continues to be the primary driver for our business; most notably around our assets in west and south Texas and in northern Louisiana Asset Summary1 Growth…
Year-to-Date Performance Adjusted EBITDA 450 422 400 350 327 300 250 211 249 200 195 150 136 100 108 50 0 2009 2010 2011 First Half of 2012 Six Months Ended June 30th Full-Year Ended Dec. 31st Highlights by…
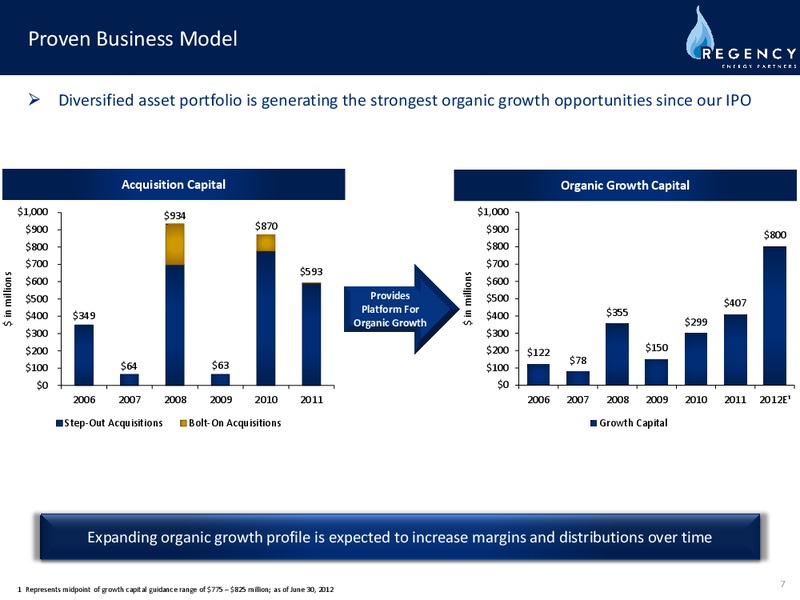
Proven Business Model Diversified asset portfolio is generating the strongest organic growth opportunities since our IPO Acquisition Capital Organic Growth Capital 1,000 934 1,000 900 870 900 800 800 800 700 700 593 in…
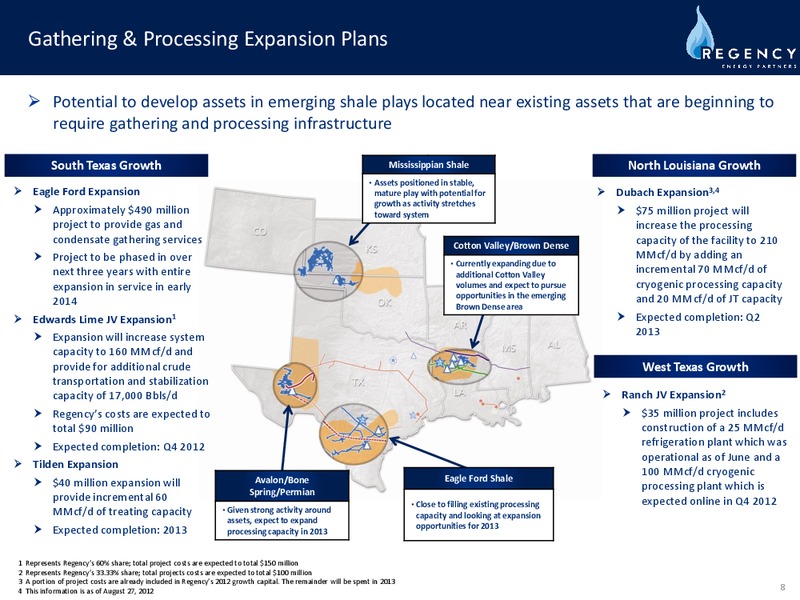
Gathering & Processing Expansion Plans Potential to develop assets in emerging shale plays located near existing assets that are beginning to require gathering and processing infrastructure South Texas Growth Mississippian Shale…
Lone Star Expansion Plans Lone Star growth projects will help address high demand for NGL transportation and processing Mont Belvieu Fractionator 1 Highlights Capacity (Bbls/d) 100,000 Contracting Status Fully Contracted…
Contract Compression Growth Opportunities Horsepower additions in liquids-rich plays are beginning to overcome declines in dry gas regions Barnett/Haynesville Opportunities Approximately 70% of horsepower was placed in oil…
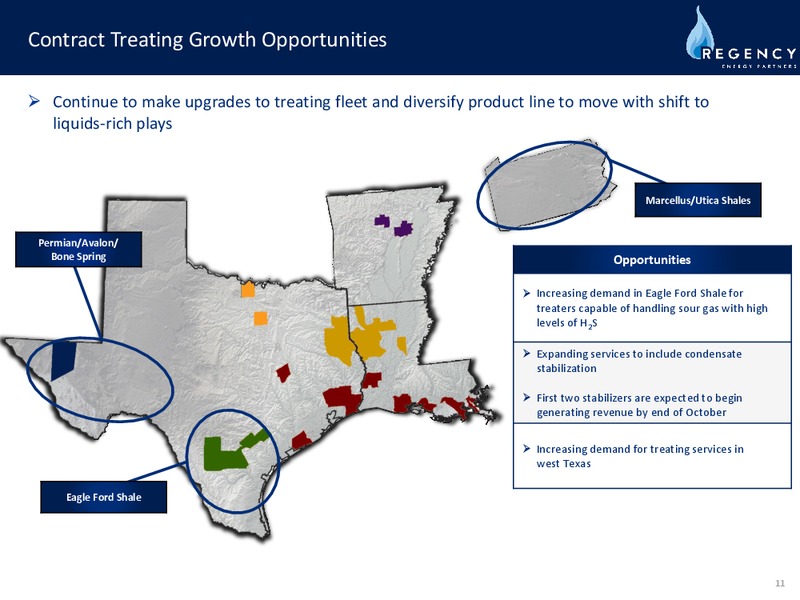
Contract Treating Growth Opportunities Continue to make upgrades to treating fleet and diversify product line to move with shift to liquids-rich plays Marcellus/Utica Shales Permian/Avalon/ Bone Spring Opportunities…
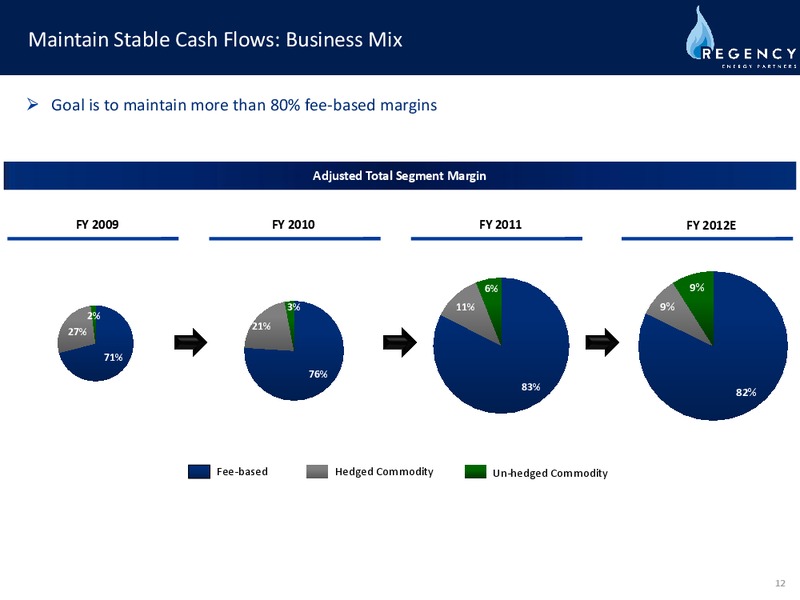
Maintain Stable Cash Flows: Business Mix Goal is to maintain more than 80% fee-based margins Adjusted Total Segment Margin FY 2009 FY 2010 FY 2011 FY 2012E Fee Hedged Unhedged 6% 9% 3% 11% 9% 2% 21% 27% 71% 76% 83%…
Concluding Thoughts Regency is well positioned to deliver distribution growth and achieve investment grade ratings over time Integrated Midstream Strategic location of assets and diverse portfolio of services provide attractive…
Appendix
Maintain Stable Cash Flows: DCF Sensitivities DCF Sensitivity to Commodity Price Changes - 2012 Change in WTI Price (/BBls) Change in Natural Gas Price Decrease 10.00 Flat Increase 10.00 (/MMbtu) Decrease 1.00 (3.8)M…
Gathering and Processing Segment Throughput volumes increased nearly 30% from the second quarter of 2011 to the second quarter of 2012, primarily driven by growth in south and west Texas and north Louisiana NGL gross production…
Joint Ventures Segment Adjusted EBITDA for the Joint Ventures segment increased from the second quarter of 2011 to the second quarter of 2012 Joint Ventures Segment Adjusted EBITDA1 70 58 57 59 60 55 56 50 in millions…
Contract Compression Segment Increased producer activity in liquids-rich plays is overcoming horsepower declines in dry-gas regions 45 Segment Margin Segment Margin ( in millions) 40 3 4 4 4 35 3 30 25 20 34 35 35 35 34…
Contract Treating Segment Focusing on accommodating shift to liquids-rich regions Contract Treating Revenue Generating GPM 4,000 4,000 20 20 3,773 3,773 3,800 3,800 18 18 Segment Margin ( in millions) Segment Margin ( in…
Maintain Stable Cash Flows: Comprehensive Hedging Program Utilize a comprehensive hedging program to mitigate exposure C2 to C4 Equity Production vs. Hedged 5,000 4,000 Bbl/d 3,000 64% 65% 2,000 84% 81% 17% 4% 1,000 7% - Q1…
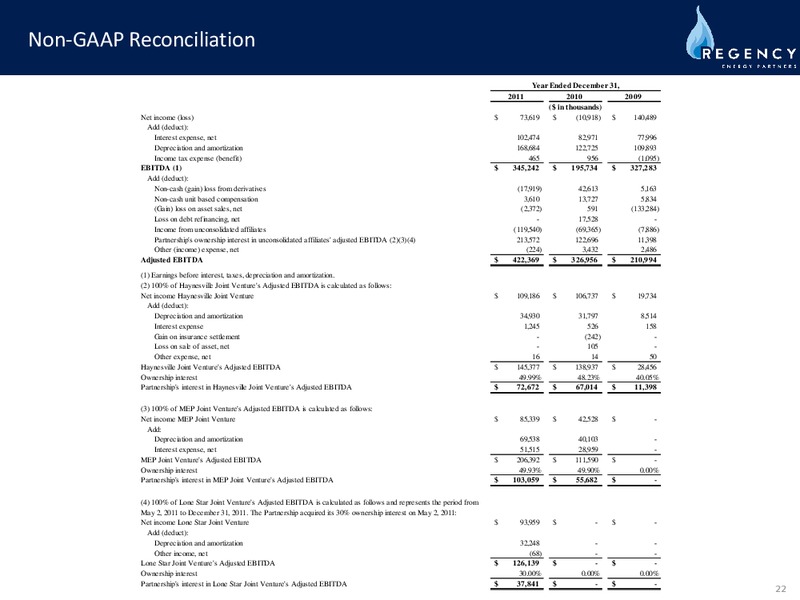
Non-GAAP Reconciliation Year Ended December 31, 2011 2010 2009 ( in thousands) Net income (loss) 73,619 (10,918) 140,489 Add (deduct): Interest expense, net 102,474 82,971 77,996 Depreciation and amortization 168,684 122,725…
Non-GAAP Reconciliation Three Months Ended June 30, 2012 March 31, 2012 December 31, 2011 September 30, 2011 June 30, 2011 ( in thousands) Net income 29,327 28,900 13,628 30,849 14,837 Add (deduct): Interest expense, net 27,934…
Non-GAAP Reconciliation Six Months Ended June 30, 2012 2011 2010 2009 ( in thousands) Net income (loss) 58,227 29,142 (9,841) 154,279 Add (deduct): Interest expense, net 57,491 44,696 44,568 33,795 Depreciation and amortization…
Non-GAAP Reconciliation Three Months Ended June 30, 2012 March 31, 2012 December 31, 2011 September 30, 2011 June 30, 2011 ( in thousands) Net income 29,327 28,900 13,628 30,849 14,837 Add (deduct): Operation and maintenance 38,992…
Non-GAAP Reconciliation Six Months Ended June 30, 2012 2011 ( in thousands) Net income 58,227 29,142 Add (deduct): Operation and maintenance 79,973 67,668 General and administrative 32,171 36,548 Loss on asset sales, net 1,584…
 Loading...