g y Energy Regency gy Partners Second Quarter Earnings Release August 9, 2010
Recent Highlights Key Accomplishments Energy Transfer Equity (ETE) acquired Regencys general partnership Achieved significant EBITDA growth following accretive acquisitions of additional interest in Growth / Haynesville and MEP…
Zephyr Gas Services Acquisition q
Zephyr Gas Services Regency has agreed to acquire Zephyr Gas Services for 185 million1 Specializes in treating, complementing Regencys Contract Compression segment g include gas Other service offerings g cooling, g, dehydration, y…
Overview of Treating Market 15,000 (Illustrative Example) Haynesville Type Curve 12,000 Expect the Haynesville and Treating Eagle Ford Shales to be the Services leading growth drivers for Required treating businesses 9 000…
Zephyr Acquisition: Potential Synergies With Contract Compression Segment Synergies Large-scale, Large-scale centralized centralized, field-wide applications Patented design of streamlined manufacturing process allows producers…
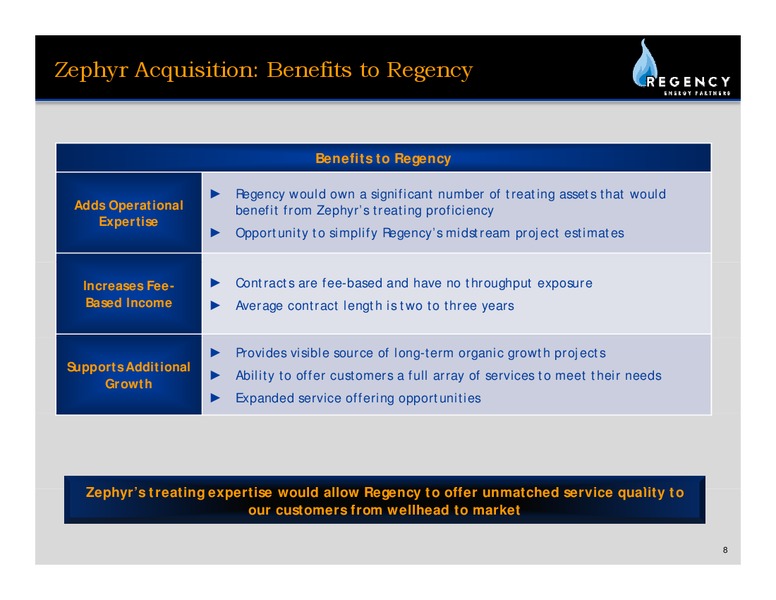
Zephyr Acquisition: Benefits to Regency Benefits to Regency Regency would own a significant number of treating assets that would Adds Operational benefit from Zephyrs treating proficiency Expertise Opportunity to simplify Regencys…
Fundamentals Review
Fundamentals: Drilling Activity 19% increase in U.S. land rig counts from Q1 2010 to Q2 2010 Rich gas plays continue to be attractive targets for producers as a result of the high crude-to-gas ratio U.S. Drilling Rig Trends 300…
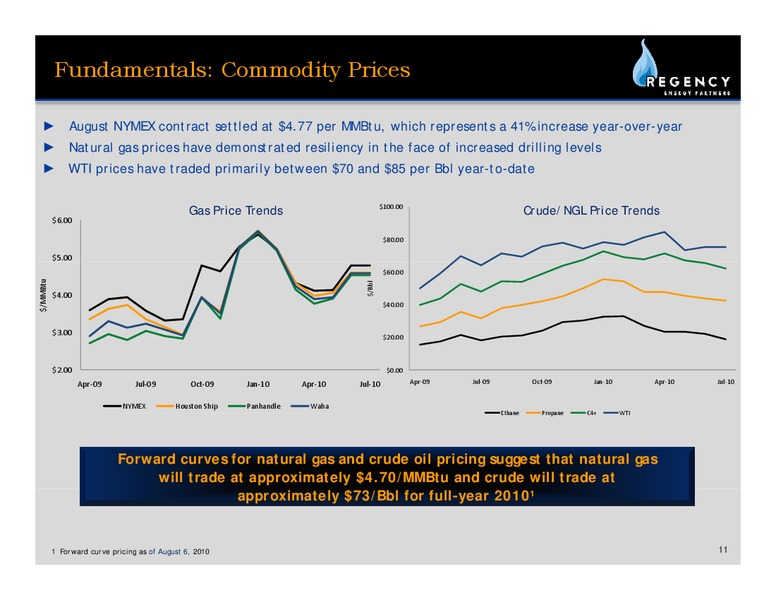
Fundamentals: Commodity Prices August NYMEX contract settled at 4.77 per MMBtu, which represents a 41% increase year-over-year Natural gas prices have demonstrated resiliency in the face of increased drilling levels WTI prices have…
Business Review
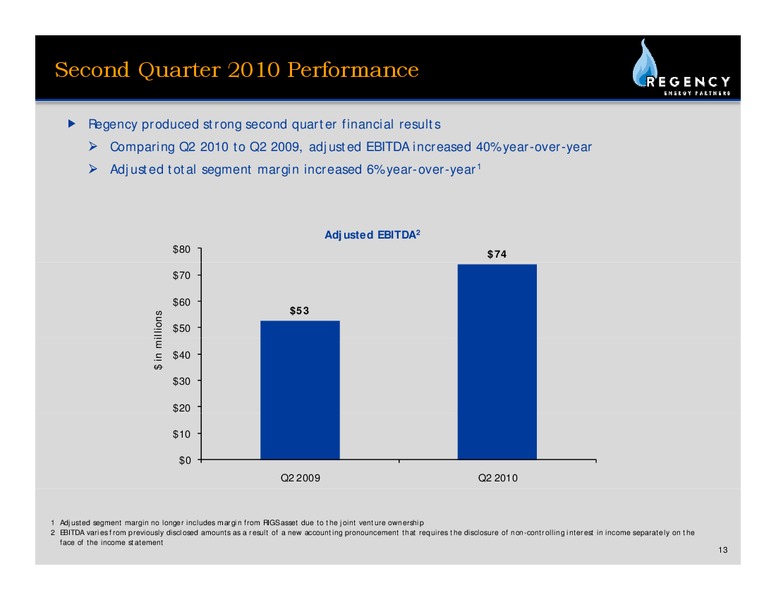
Second Quarter 2010 Performance f Regency produced strong second quarter financial results Comparing Q2 2010 to Q2 2009, adjusted EBITDA increased 40% year-over-year Adjusted total segment margin increased 6% year-over-year1…
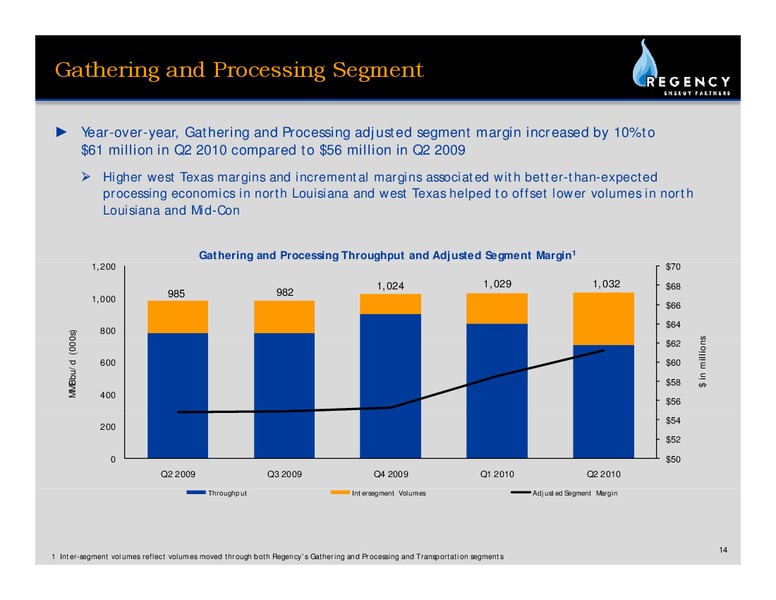
Gathering and Processing Segment Year-over-year, Gathering and Processing adjusted segment margin increased by 10% to 61 million in Q2 2010 compared to 56 million in Q2 2009 Higher west Texas margins and incremental margins associated…
Transportation Segment Adjusted EBITDA increased to 25 million in Q2 2010 from 3 million in Q2 2009 Increase due to the Haynesville Expansion Project coming online, increased Haynesville Joint Venture ownership by 66.99%, 99% and…
Contract Compression Segment Regencys Contract Compression segment has benefited from a continued increase in drilling activity Revenue generating horsepower increased 3% year-over-year from Q2 2009 to Q2 2010 Revenue Generating…
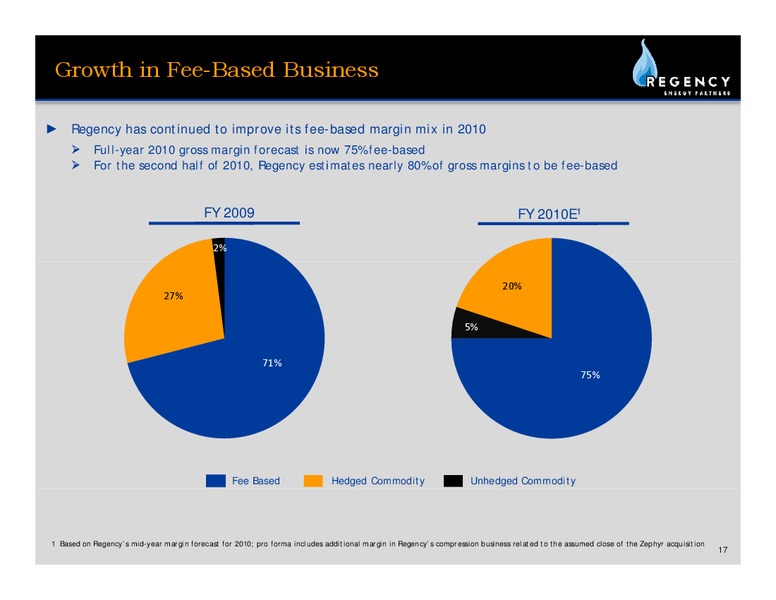
Growth in Fee-Based Business Regency has continued to improve its fee-based margin mix in 2010 Full-year 2010 gross margin forecast is now 75% fee-based For the second half of 2010, Regency estimates nearly 80% of gross margins to be…
Financial Review
Consolidated Operating Results (Year-Over-Year) Regency Energy Partners LP Consolidated Income Statements ( in thousands) Three Months Ended June 30, 2010 June 30, 2009 REVENUES Gas sales, including related party amounts…
Commodity Price Risk Management f 81% of NGLs, 83% of condensate, and 74% of natural gas are hedged for the balance of 2010 f 67% of NGLs, 74% of condensate, and 42% of natural gas are hedged for 2011 f 6% of NGLs and 7% of condensate…
Commodity Price Risk Management f We have executed NGL and condensate hedges at 25% of expected equity production for the first quarter of 2012 f Throughout the second half of 2010, we expect to incrementally increase our hedge levels…
Commodity Price Risk Management DCF Sensitivity to Commodity Price Changes Balance of Year 2010 Change in WTI Price (/Bbl) Change in Natural Gass ( in millions) Decrease 10.00 Flat Increase 10.00 e (/MMBtu) Decrease 1.00…
Capital Spend Forecast For 2010 f Regency increased its expected full-year 2010 organic growth capital expenditures to 245 million from 180 million, as noted below: 178 million related to the Gathering and Processing segment 59…
Q&A
Appendix
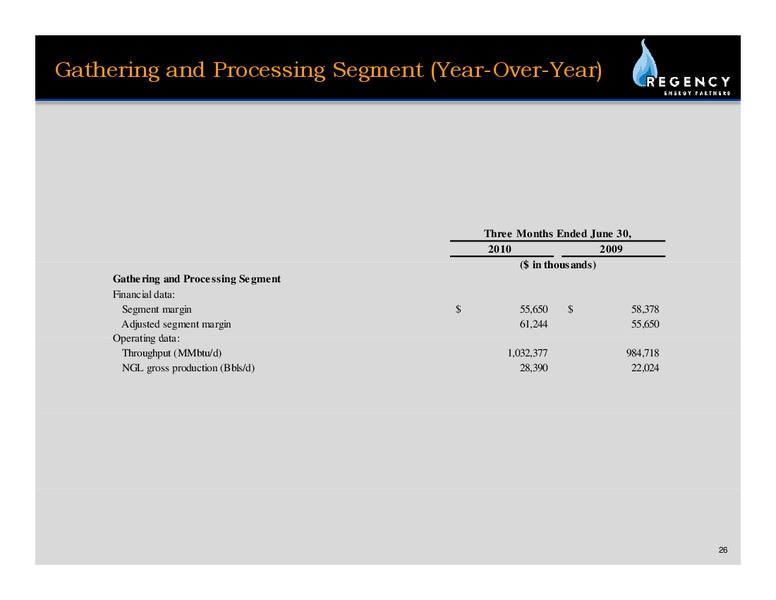
Gathering and Processing Segment (Year-Over-Year) Three Months Ended June 30, 2010 2009 ( in i thousands) th d ) Gathering and Processing Segment Financial data: Segment margin 55,650 58,378 Adjusted segment margin 61,244…
Combined Transportation Segment (Year-Over-Year) Three Months Ended June 30, 2010 2009 ( in thousands) Transportation p Segment g Financial data: Segment margin - 160 Operating data: Throughput (MMbtu/d) - - Three Months…
Contract Compression Segment (Year-Over-Year) Three Months Ended June 30, 2010 2009 ( iin thousands) th d ) Contract Compression Segment Financial data: Segment margin 37,814 35,800 Operating data: Revenue generating…
Corporate and Others Segment (Year-Over-Year) Three Months Ended June 3030, 2010 2009 ( in thousands) Corporate & Others Financial data: Segment margin 5 461 5,461 2 832 2,832 29
Non-GAAP Reconciliation (Year-Over-Year) Three Months Ended June 30, Six Months Ended June 30, 2010 2009 2008 2010 2009 2008 ( in thousands) ( in thousands) Net (loss) income (9,391) 5,955 9,903 (9,841) 154,379 20,323 Add (deduct):…
Non-GAAP Reconciliation (Year-Over-Year) Three Months Ended June 30, Six Months Ended June 30, 2010 2009 2008 2010 2009 2008 ( in thousands) ( in thousands) Adjusted Total Segment Margin 98,726 93,467 117,502 195,675 197,352 212,246…
Non-GAAP Reconciliation (Year-Over-Year) Three Months Ended June 30, Six Months Ended June 30, 2010 2009 2008 2010 2009 2008 ( in thousands) ( in thousands) Net (loss) income (9,391) 5,955 9,903 (9,841) 154,379 20,323 Add (Deduct):…
Non-GAAP Reconciliation Three Months Ended June 30, 2010 ( in thousands) Net cash flows provided by operating activities 40,433 Add (deduct): Depreciation and amortization, including debt issuance cost amortization (31,304) Income…
Non-GAAP Reconciliation (2010 Guidance) Low Estimate High Estimate (( in thousands)) Forecasted net income 65,000 85,000 Add: Depreciation and amortization 120,000 120,000 Interest Expense 75,000 80,000 EBITDA at JV in excess of…
 Loading...