Regency g y Energy gy Partners Fourth Quarter Earnings Release March 1, 2010
2009 Highlights
2009 Highlights 2009 Goals Execution Achieved X Generated 205 million in adjusted EBITDA with X Achieve adjusted EBITDA guidance range four solid quarters of operating performance for y full-year 2009 X Construction completed under…
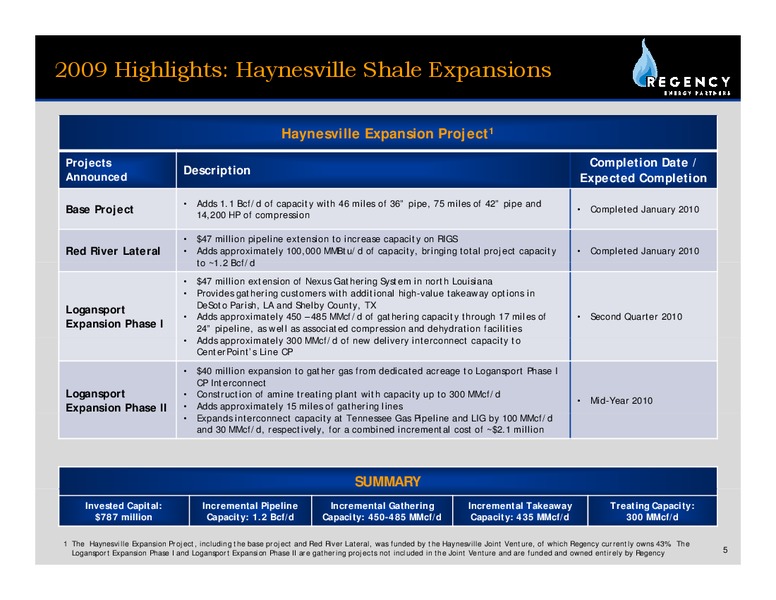
2009 Highlights: Haynesville Shale Expansions Haynesville Expansion Project1 Projects Completion Date / Description Announced Expected Completion Adds 1.1 Bcf/d of capacity with 46 miles of 36 pipe, 75 miles of 42 pipe and Base…
Fundamentals Review
Fundamentals: Drilling Activity Despite depressed energy prices, rig counts began to rise in the third quarter of 2009 and continued to increase over the course of the year, driven by low-cost shale plays, including the…
Fundamentals: Commodity Prices NYMEX gas prices have rebounded since the third quarter of 2009, from a September 2009 contract settlement of 2.51 per MMBtu, to 5.27 per MMBtu for February 2010 WTI crude ended January 2010 trading at…
Business Review
Quarter-Over-Quarter Performance f Demonstrated consistent performance across all four quarters of 2009 f Generated 420 million of combined adjusted total segment margin in 2009, with each of our three businesses remaining relatively…
Majority Fee-Based Portfolio Since 2007, Regency has made a concerted effort to grow fee-based margins 71% of Regencys Adjusted Segment Margin in 2009 was attributable to stable, fee-based cash flows Only 5% of Adjusted Segment…
Transportation Segment Combined transportation segment volumes were down quarter-over-quarter throughout 2009 due to a decline in volumes driven by reduced levels of Cotton Valley drilling and compressed basis differentials between…
Gathering and Processing Segment Despite a difficult commodity environment, including a steep decline in gas prices for the first three quarters of 2009, Regencys Gathering and Processing volumes and segment margin have remained…
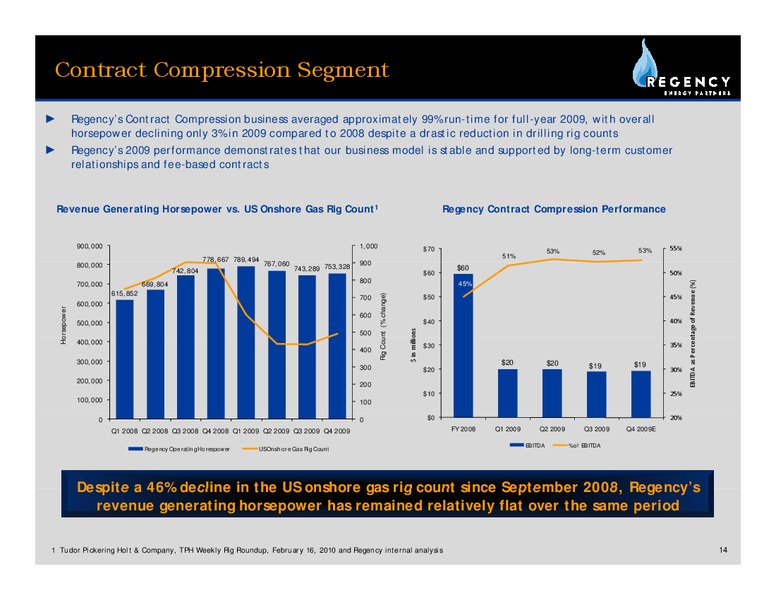
Contract Compression Segment Regencys Contract Compression business averaged approximately 99% run-time for full-year 2009, with overall horsepower declining only 3% in 2009 compared to 2008 despite a drastic reduction in drilling rig…
Financial Review
Consolidated Operating Results Regency Energy Partners LP Consolidated Income Statements ( in thousands) Three Months Ended December 31, 2009 September 30, 2009 June 30, 2009 March 31, 2009 REVENUES Gas sales 128,636 97,597…
Commodity Price Risk Management f Regency believes that maintaining a strong hedging program enables us to more accurately project and maintain stable cash flows f We expect to execute additional hedges for 2011 through the balance of…
Commodity Price Risk Management In aggregate, 80% of NGLs, 84% of condensate and 85% of natural gas are hedged for 2010 34% of NGLs, 42% of condensate and 27% of natural gas are hedged for 2011 E Executed t dHHedges d by b…
Commodity Price Risk Management DCF Sensitivity to Commodity Price Changes - 2010 Change in WTI Price (/bbl) Change in Natural Gass ( in millions) Decrease 10.00 Flat Increase 10.00 e (/MMbtu) Decrease 1.00 (3.0) (0.5)…
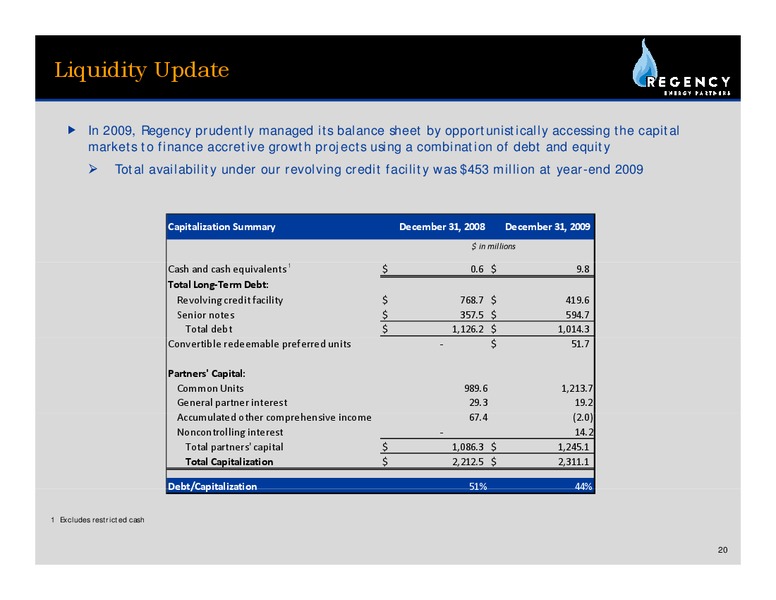
Liquidity Update f In 2009, Regency prudently managed its balance sheet by opportunistically accessing the capital markets to finance accretive growth projects using a combination of debt and equity Total availability under our…
Capital Spend for 2010 f We expect our growth capital expenditures for 2010 to be approximately 167 million, inclusive of Regencys portion of growth capital expenditures related to the Haynesville Joint Venture f Our anticipated…
Q&A
Appendix
Gathering and Processing Segment (Year-Over-Year) Three Months Ended December 31, Year Ended 2009 2008 2009 2008 ( in thousands) Gathering and Processing Segment Financial data (1): Segment margin 54,828 72,769 230,512 264,405…
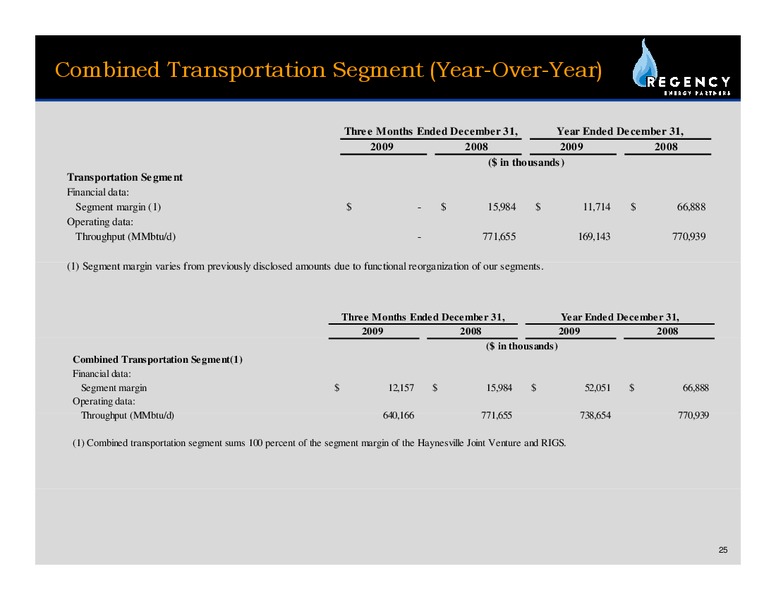
Combined Transportation Segment (Year-Over-Year) Three Months Ended December 31, Year Ended December 31, 2009 2008 2009 2008 ( in thousands) Transportation Segment Financial data: Segment margin (1) - 15,984 11,714 66,888…
Contract Compression Segment (Year-Over-Year) Three Months Ended December 31, Year Ended December 31, 2009 2008 2009 2008 ( in thousands) Contract Compression Segment Financial data: Segment margin 34,163 33,351 141,028 125,503…
Non-GAAP Reconciliation Three Months Ended December 31, 2009 September 30, 2009 June 30, 2009 March 31, 2009 ( in thousands) Net (loss) income (3,347) (10,543) 5,955 148,424 Add (deduct): Interest expense, net 22,028 22,173 19,568…
Non-GAAP Reconciliation1 Three Months Ended December 31, 2009 September 30, 2009 June 30, 2009 March 31, 2009 ( in thousands) Adjusted Total Segment Margin 91,717 90,342 93,467 103,885 Adjusted Total Segment Margin for Haynesville…
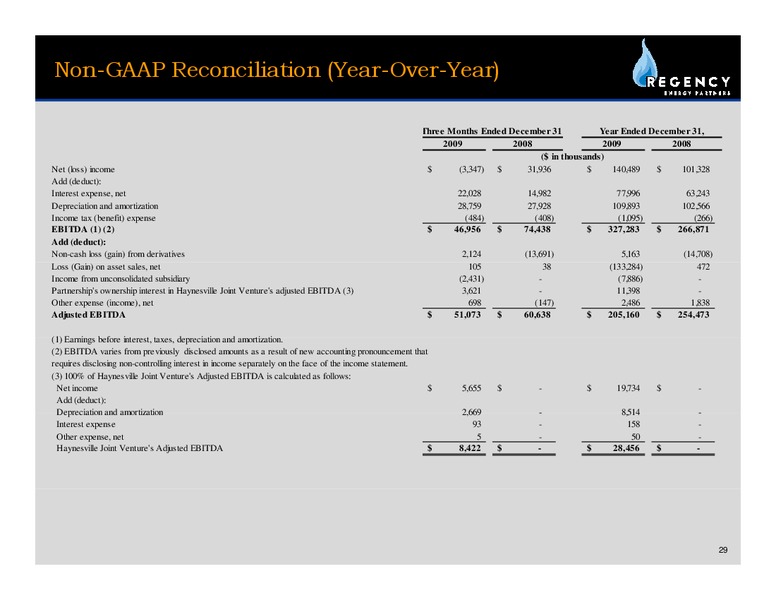
Non-GAAP Reconciliation (Year-Over-Year) Three Months Ended December 31 Year Ended December 31, 2009 2008 2009 2008 ( in thousands) Net (loss) income (3,347) 31,936 140,489 101,328 Add (deduct): Interest expense, net 22,028 14,982…
Non-GAAP Reconciliation (Year-Over-Year) Three Months Ended December 31, Year Ended December 31, 2009 2008 2009 2008 ( in thousands) Net (loss) income (3,347) 31,936 140,489 101,328 Add (Deduct): Operation and maintenance 30,671…
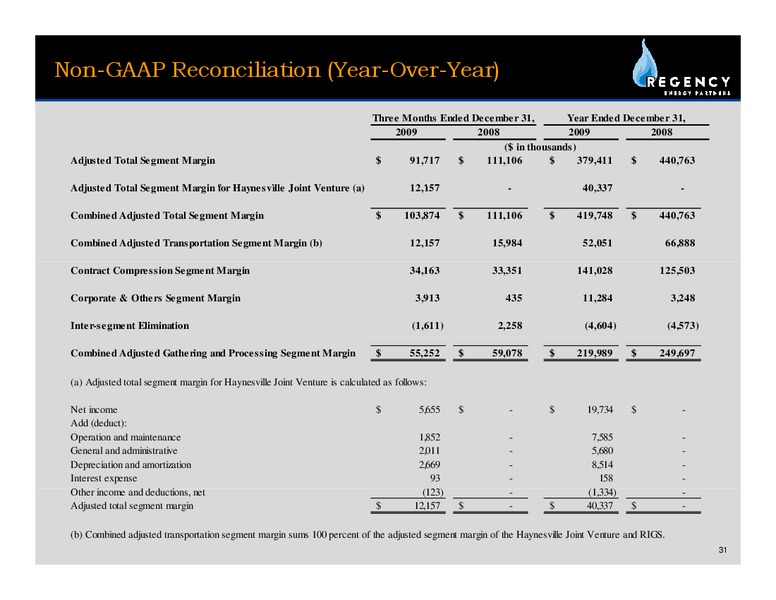
Non-GAAP Reconciliation (Year-Over-Year) Three Months Ended December 31, Year Ended December 31, 2009 2008 2009 2008 ( in thousands) Adjusted Total Segment Margin 91,717 111,106 379,411 440,763 Adj sted Total Segment Margin for Ha…
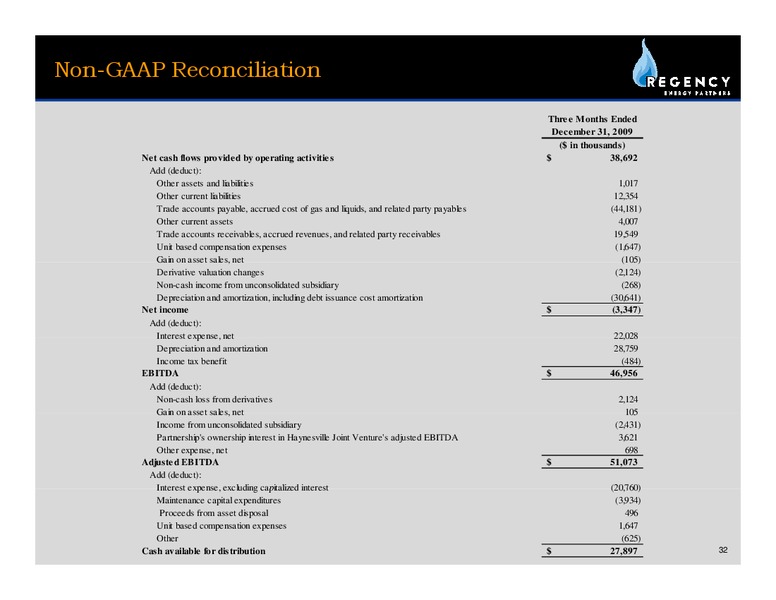
Non-GAAP Reconciliation Three Months Ended December 31, 2009 ( in thousands) Net cash flows provided by operating activities 38,692 Add (deduct): Other Ot e assets and a d liabilities ab t es 1,017 ,0 7 Other current…
 Loading...