Regency Energy Partners Morgan Stanley Corporate Access Day March 16, 2011
Forward-Looking Statements Certain matters discussed in this report include forward-looking statements. Forward-looking statements are identified as any statement that does not relate strictly to historical or current facts. Statements…
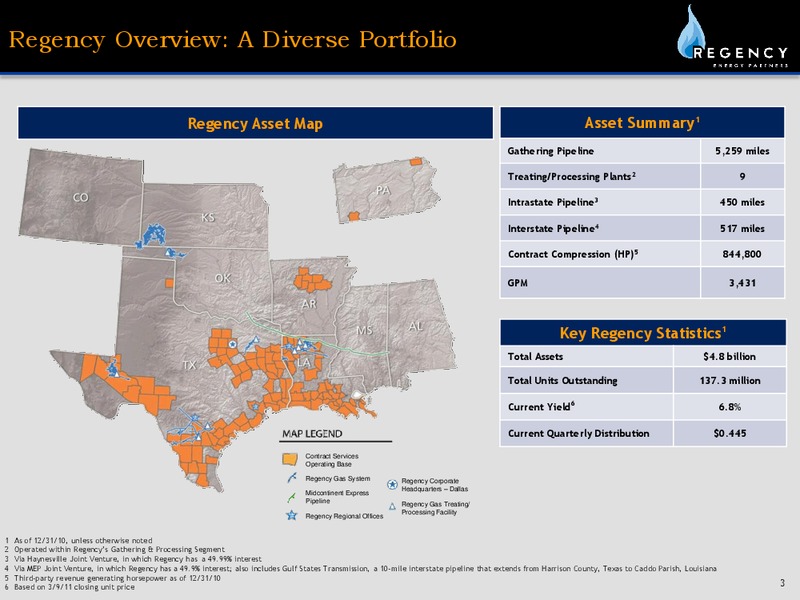
Regency Overview: A Diverse Portfolio Regency Asset Map Asset Summary1 Gathering Pipeline 5,259 miles Treating/Processing Plants2 9 Intrastate Pipeline3 450 miles Interstate Pipeline4 517 miles Contract Compression (HP)5…
2010 Highlights Key Highlights Energy Transfer Equity acquired 100% of Regencys general partner Partnership Introduced new senior leadership team with extensive experience in the midstream industry Acquired 49.9% interest in…
Benefits of Regency and ETE Relationship Energy Transfer Equity, L.P. (ETE), which also owns the general partner of ETP, acquired Regencys general partnership on May 26, 2010 ETE is supportive of growing Regencys cash flow and our…
Future Growth Opportunities Regency has exceptional opportunities across our diverse business portfolio Region Gathering Processing Compression Treating Transportation Eagle Ford Shale Marcellus Shale Haynesville…
Business Review
2010 Performance Adjusted EBITDA1 In 2010, Regency produced strong financial 50 350 327 43 results 45 300 40 Comparing results year-over-year, 250 35 211 adjusted EBITDA improved 55% 30 in millions 200 25 25 150…
Gathering and Processing Segment Margins continued to increase in the fourth quarter primarily due to increased Eagle Ford volumes in our south Texas region Gathering and Processing Throughput and Adjusted Segment Margin1,2 1,200…
Transportation Segment Regencys share of Adjusted EBITDA increased to 123 million for full-year 2010 from 11 million for full-year 2009 Transportation Segment Adjusted EBITDA1 50 43 44 45 40 35 30 in millions 25 25…
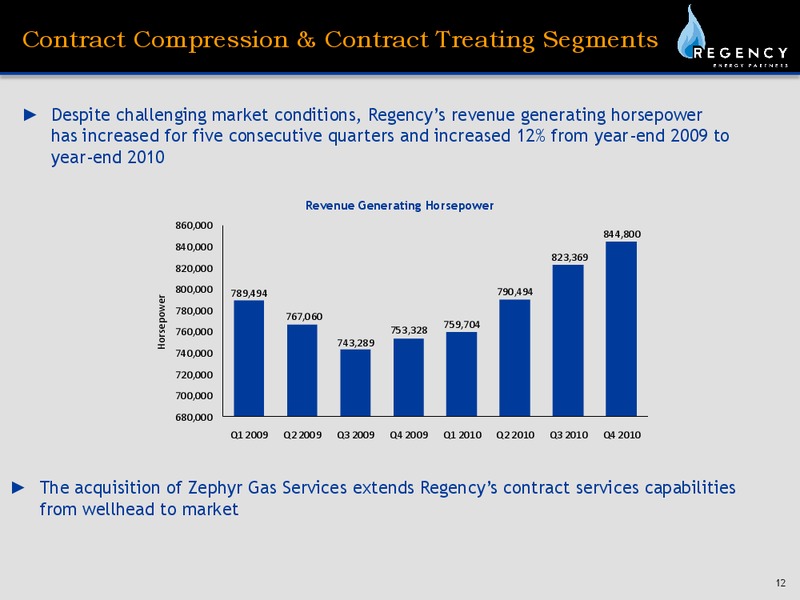
Contract Compression & Contract Treating Segments Despite challenging market conditions, Regencys revenue generating horsepower has increased for five consecutive quarters and increased 12% from year-end 2009 to year-end 2010…
Concluding Thoughts Regencys total return to unitholders over the last 12 months was 30% Regency 12-Month Performance 16% 14% 26 30 12% 25 14% (/unit) Price(/unit) Regency Dividend Yield (%) 22 10% Dividend Yield…
Appendix
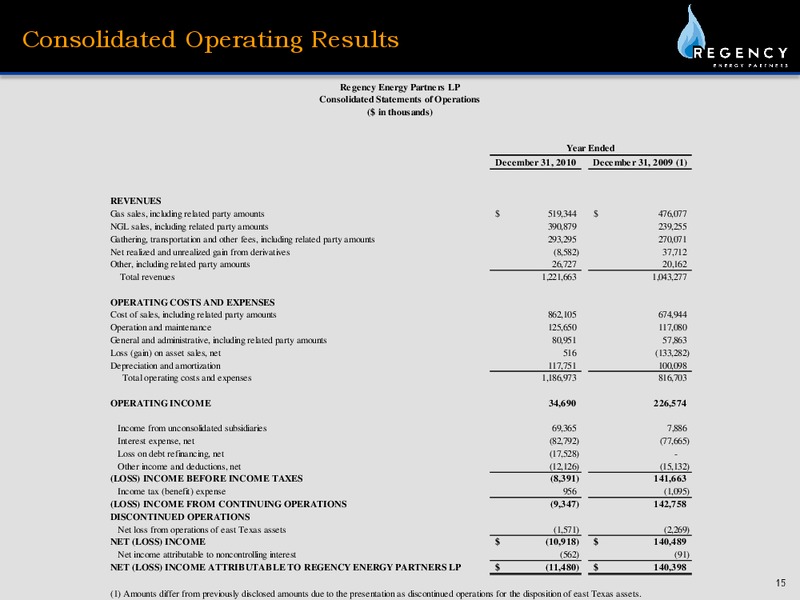
Consolidated Operating Results Regency Energy Partners LP Consolidated Statements of Operations ( in thousands) Year Ended December 31, 2010 December 31, 2009 (1) REVENUES Gas sales, including related party amounts 519,344…
Gathering and Processing Segment Three Months Ended December 31, 2010 September 30, 2010 June 30, 2010 March 31, 2010 ( in thousands) Gathering and Processing Segment Financial data: Segment margin (1) 52,915 42,723 49,568 50,802…
Contract Compression Segment Three Months Ended December 31, 2010 September 30, 2010 June 30, 2010 March 31, 2010 ( in thousands) Contract Compression Segment (1) Financial data: Segment margin 40,855 38,510 37,814 37,030 Operating…
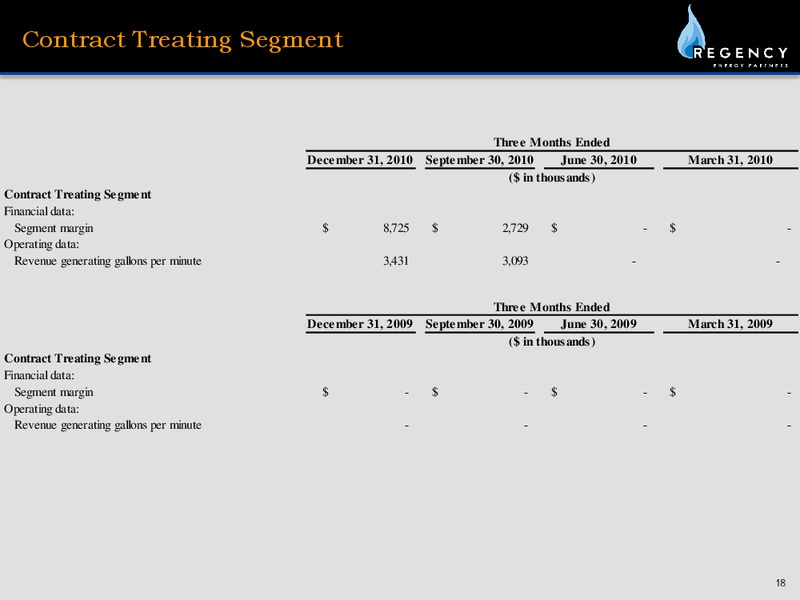
Contract Treating Segment Three Months Ended December 31, 2010 September 30, 2010 June 30, 2010 March 31, 2010 ( in thousands) Contract Treating Segment Financial data: Segment margin 8,725 2,729 - - Operating data: Revenue…
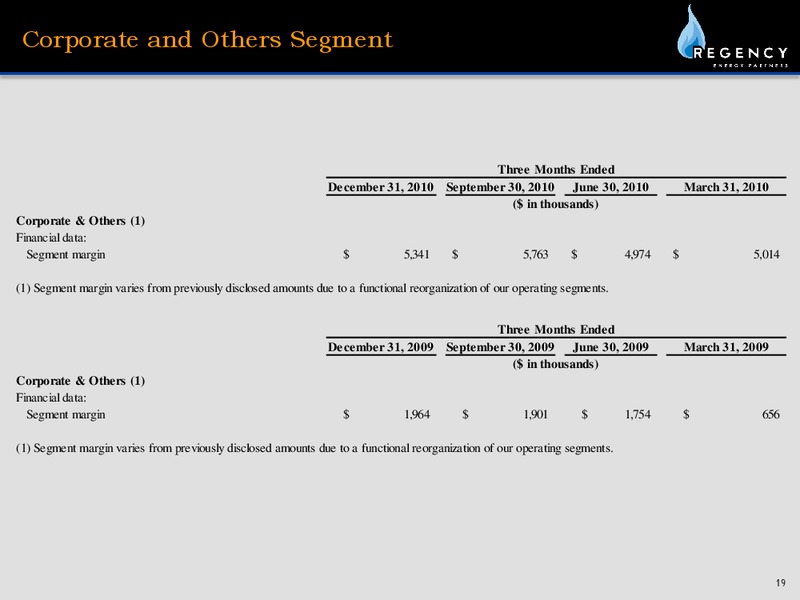
Corporate and Others Segment Three Months Ended December 31, 2010 September 30, 2010 June 30, 2010 March 31, 2010 ( in thousands) Corporate & Others (1) Financial data: Segment margin 5,341 5,763 4,974 5,014 (1) Segment margin…
Transportation Segment Haynesville Joint Venture The following provides key performance measures for 100% of the Haynesville Joint Venture Three Months Ended December 31, 2010 September 30, 2010 June 30, 2010 March 31, 2010 ( in…
Transportation Segment MEP Joint Venture The following provides key performance measures for 100% of the MEP Joint Venture Three Months Ended December 31, 2010 September 30, 2010 June 30, 2010 March 31, 2010 ( in thousands)…
Non-GAAP Reconciliation Year Ended December 31, 2010 2009 2008 ( in thousands) Net (loss) income (10,918) 140,489 101,328 Add (deduct): Interest expense, net 82,971 77,996 63,243 Depreciation and amortization 122,725 109,893…
Non-GAAP Reconciliation Year Ended December 31, 2010 2009 2008 ( in thousands) Net (loss) income (10,918) 140,489 101,328 Add (Deduct): Operation and maintenance 125,650 117,080 119,715 General and administrative 80,951 57,863…
Non-GAAP Reconciliation Three Months Ended December 31, 2010 ( in thousands) Net cash flows provided by operating activities 41,304 Add (deduct): Depreciation and amortization, including debt issuance cost amortization (34,556)…
 Loading...