GOING BEYOND Regency Energy Partners LP Investor Day Presentation April 6, 6 2011
ForwardLooking Statements Certain matters discussed in this report include forward-looking statements. Forward-looking statements are identified as any statement that does not relate strictly to historical or current facts. Statements…
Agenda The Road Ahead ETPRGNC Midstream LLC Overview Business Segment Overviews Financial Overview Conclusion Q&A 3
The Road Ahead 4
Solid Foundation Supportive General Partner pp Energy Transfer Equity brings significant expertise in the midstream sector Energy Transfer Equity brings significant expertise in the midstream sector With the announced Joint…
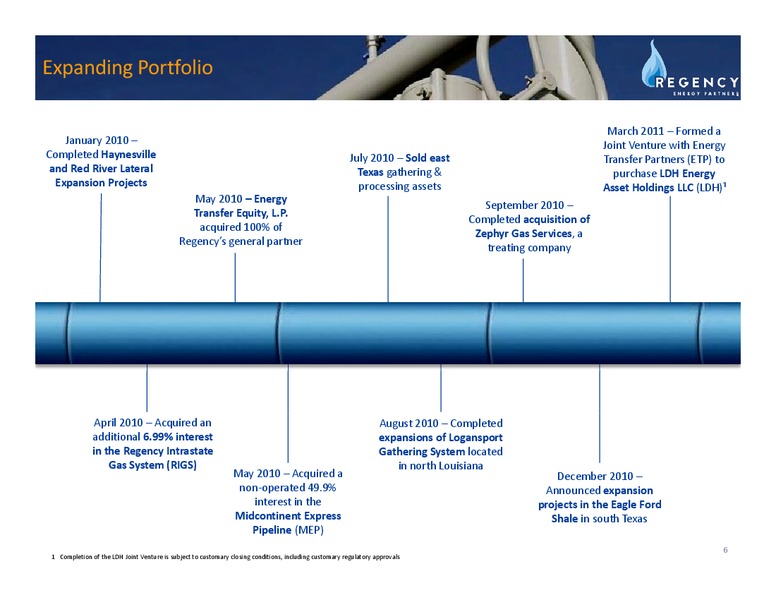
Expanding Portfolio March 2011 Formed a January 2010 Joint Venture with Energy Completed Haynesville July 2010 Sold east Transfer Partners (ETP) to and Red River Lateral Texas gathering & purchase LDH Energy Expansion Projects p…
Expanding Portfolio From the wellhead to market, Regency offers a full range of midstream natural gas services, including natural gas gathering and processing, contract compression, contract treating and transportation The LDH Joint…
Expanding Portfolio Regencys diversification extends not only geographically, but vertically across the midstream value chain 2009 Adjusted Segment Margin 2009 Adjusted Segment Margin 2010 Adjusted Segment Margin 2010 Adjusted…
Strategic Objectives and Goals Regencys Mission: To create value for our customers by providing the best services in the midstream natural gas industry. In doing so, we expect to achieve superior returns for our investors Maximize…
Growth Opportunities Regencys presence across multiple formations provides an advantage over less diversified MLPs Regency Asset Base Including LDH Assets Marcellus Shale Permian Basin Barnett Shale Barnett Shale…
Growth Opportunities: South Texas Significant increase in midstream infrastructure will be necessary to handle the increasing gas, NGL, and condensate production Eagle Ford Shale Gathering & Processing Transportation…
Growth Opportunities: West Texas With current oil prices, producer activity has continued to pick up in the region Bone Springs and Avalon Shale, along with traditional Permian producing formations, will provide opportunities to fill…
Growth Opportunities: North Louisiana Driven by drilling programs on committed acreage and a backlog of wells waiting on frac completions, volumes are expected to increase on our Logansport system Continued drilling around Cotton…
Growth Opportunities: Marcellus Shale With minimal existing infrastructure in the emerging Marcellus Shale, Regency sees numerous opportunities to work with producers to provide additional compression and treating applications As…
ETPRGNC Midstream Overview
ETPRGNC Midstream: Transaction Overview Energy Transfer Partners, L.P. and Regency Energy Partners LP have formed a Joint Venture to purchase LDH Energy Asset Holdings LLC ETP will contribute 1.35 billion in exchange for a 70%…
ETPRGNC Midstream: Strategic Rationale The Joint Venture positions Regency as a significant player in the NGL business Strategic Rationale Strategically Located Mont Belvieu, Texas Assets Permian Basin and Barnett Shale…
ETPRGNC Midstream: Asset Overview The midstream assets include storage, pipeline, fractionation and processing facilities which handle a wide array of energy products, including natural gas, NGLs, petrochemicals and refined…
ETPRGNC Midstream: Storage Mont Belvieu Storage Facility NGLs, refined products and petrochemicals (ethylene) 43 million Bbls of cavern capacity in 24 salt dome caverns; 23 million Bbls brine pond capacity Connects to 16 pipelines,…
ETPRGNC Midstream: Pipeline Transportation West Texas Pipeline Intrastate NGL pipeline system running from the Permian Basin and Barnett Shale to Mont Belvieu 1,066mile longhaul 12 pipeline 144,000 Bbls/d of capacity…
ETPRGNC Midstream: Fractionation and Processing Refinery Services Off-gas processing and Olefins-grade NGL fractionation complex that cryogenically processes refinery off-gas, returning the methane stream to the refiners for use as…
ETPRGNC Midstream: Combined Assets LDHs assets complement both Regencys and ETPs current geographic footprints Regency, Energy Transfer and Joint Venture Asset Map 22
ETPRGNC Midstream: NGL Market Fundamentals As natural gas producers continue to drill in NGLrich areas, the increased supply will create the need for additional NGL infrastructure Current Fundamentals Current Fundamentals WTI…
ETPRGNC Midstream, LLC: Conclusion The Joint Venture will immediately give ETP and Regency a strong position in the liquids business that would be difficult to establish organically Transaction Benefits Transaction Benefits LDH…
Gathering & Processing Segment Overview 25
Gathering and Processing: Overview Regencys gathering and processing operations are primarily located in Texas, Louisiana, Oklahoma and Kansas Gathering & Processing Asset Summary Total Processing Plants 6 Total Treating…
Gathering and Processing: Overview Throughput in 2010 increased slightly as additional volumes from liquidsrich plays more than offset declines in conventional fields Majority of the growth in throughput volumes came from south…
Gathering and Processing: MidContinent MidContinent Plants 1 Gathering System Length (miles) 3,470 Compression (HP) 40,576 Total Processing Capacity (MMcf/d) 50 Key Assets Mocane Processing Plant Mocane Processing Plant 50…
Gathering and Processing: West Texas West Texas Plants 1 Gathering System Length (miles) 806 Compression (HP) 48,574 Total Processing Capacity (MMcf/d) 125 Total Treating Capacity (GPM) 400 Key Assets Waha Processing Plant…
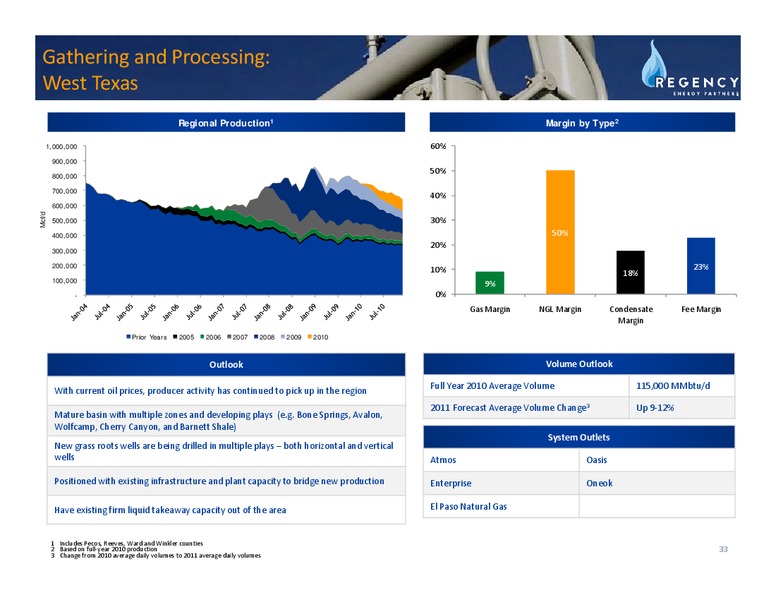
Gathering and Processing: West Texas Regional Production1 Margin by Type2 1,000,000 60% 900,000 50% 800,000 Dont add to 100% 700,000 40% 600,000 Mcf/d 500,000 30% 400,000 50% 20% 300,000 200,000 23% 10% 18%…
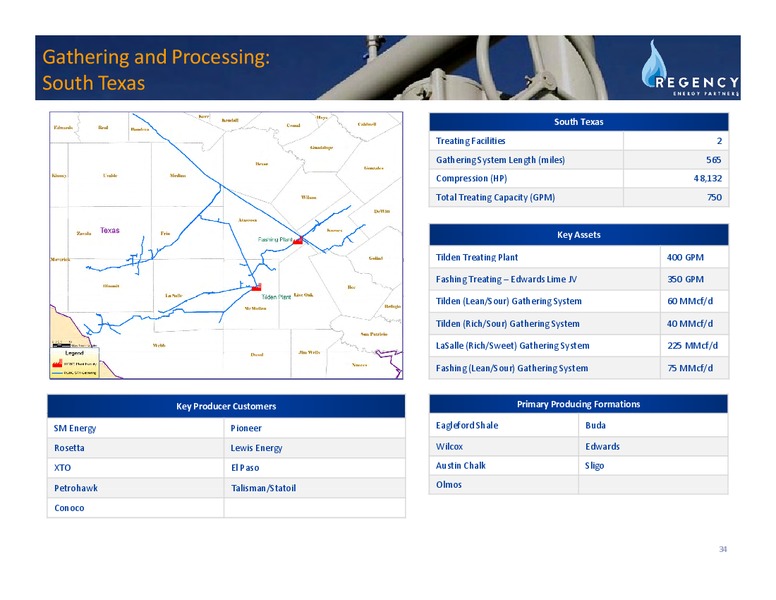
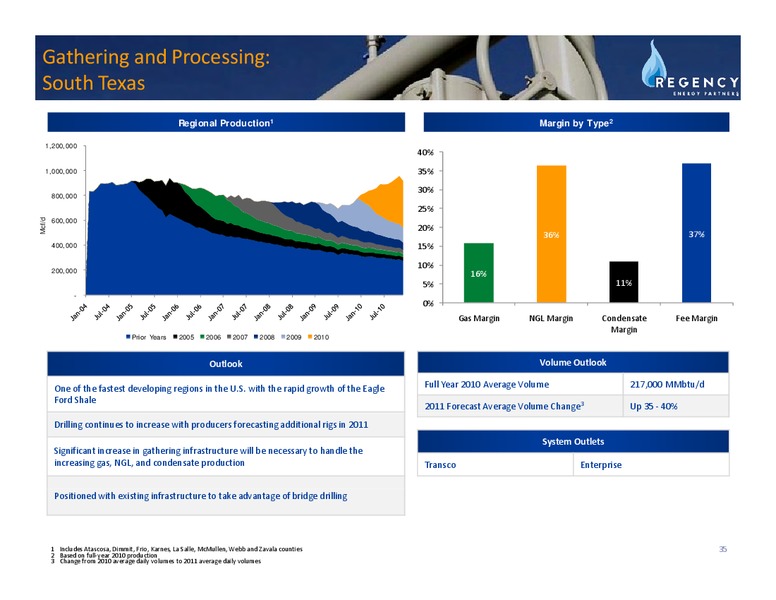
Gathering and Processing: South Texas South Texas Treating Facilities 2 Gathering System Length (miles) 565 Compression (HP) 48,132 Total Treating Capacity (GPM) 750 Key Assets Tilden Treating Plant 400 GPM Fashing Treating…
Gathering and Processing: South Texas Regional Production1 Margin by Type2 1,200,000 40% 1,000,000 35% 30% 800,000 25% 600,000 Mcf/d 20% 36% 37% 400,000 15% 10% 200,000 16% 5% 11% - 0% Gas Margin NGL Margin…
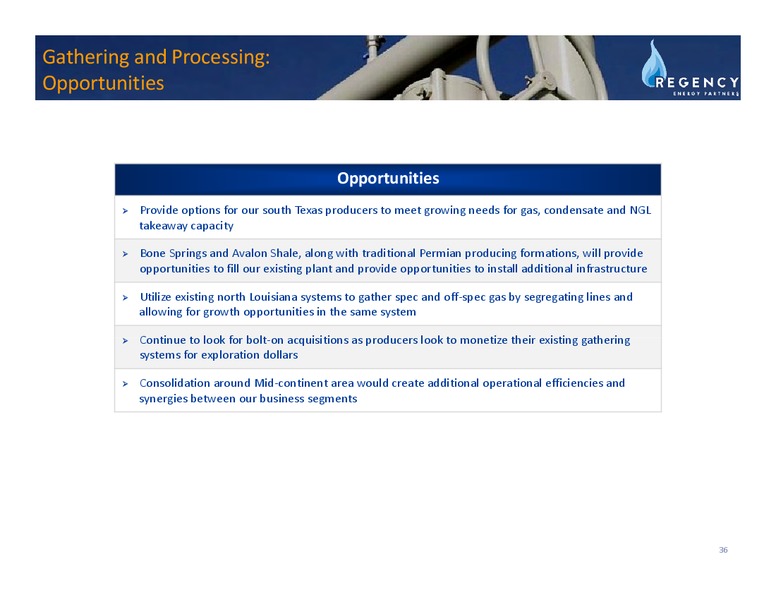
Gathering and Processing: Opportunities Opportunities pp Provide options for our south Texas producers to meet growing needs for gas, condensate and NGL takeaway capacity Bone Springs and Avalon Shale, along with traditional…
Transportation Segment Overview
Transportation Segment: RIGS The Haynesville Joint Venture completed the Haynesville Expansion Project in January 2010 Regency acquired an additional 6.99% ownership interest in the Haynesville Joint Venture in April 2010 RIGS…
Transportation Segment: MEP Regency acquired a 49.9% interest in MEP from Energy Transfer in May 2010, representing our first major investment in an interstate pipeline MEP Joint Venture Partnership Structure MEP Details Regency…
Transportation Segment RIGS volumes continued to increase as expansion volumes Regency acquired its 49.9% interest in MEP on May 26, 2010 came online and Hayneville production continued to increase In addition, an expansion which…
Contract Compression: Overview Core compression operations in Texas, Louisiana, Arkansas and Pennsylvania HP by Region, Region Total HP of Units Central 148,995 160 Gulf Coast 271,506 359 North 181,030 128 West 243,269 368…
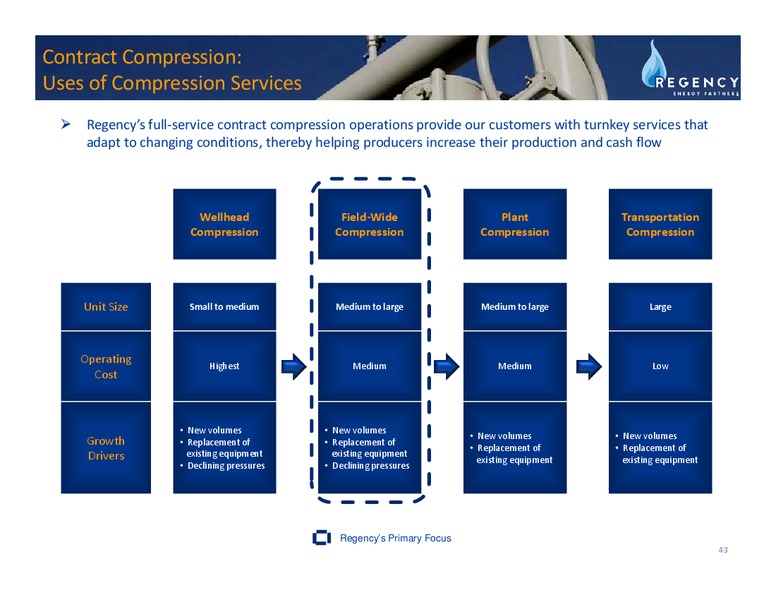
Contract Compression: Uses of Compression Services Regencys fullservice contract compression operations provide our customers with turnkey services that adapt to changing conditions, thereby helping producers increase their production…
Contract Compression Benefits of Contract Compression Limited exposure to natural gas prices FeeBased Margin Margins based on monthly fee regardless of throughput Producers cash flows are compressiondependent Compressors are…
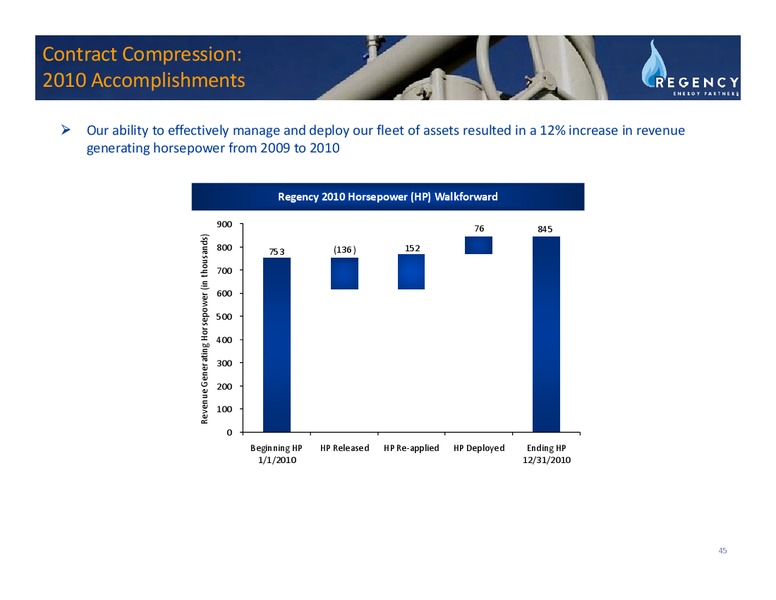
Contract Compression: 2010 Accomplishments Our ability to effectively manage and deploy our fleet of assets resulted in a 12% increase in revenue generating horsepower from 2009 to 2010 Regency 2010 Horsepower (HP) Walkforward…
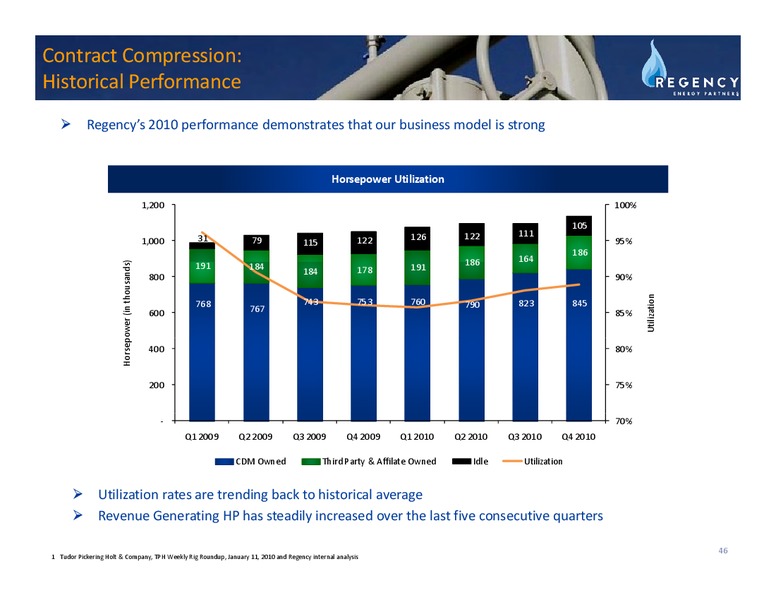
Contract Compression: Historical Performance Regencys 2010 performance demonstrates that our business model is strong Horsepower Utilization 1,200 100% 105 126 122 111 1,000 31 79 115 122 95% 186 186 186 164 Horsepower…
Contract Compression: 2011 Goals 2011 Goals Focus on emerging shale plays, including the Eagle Ford and Marcellus shales Leverage strong operational footprint to deploy horsepower in north Louisiana, east Texas and south…
Contract Treating: Overview With the acquisition of Zephyr Gas Services, Regency expanded its service offerings to include a highquality treating platform Zephyr contributed 11 million in segment margin for the period from September…
Contract Treating: Overview Our contract treating business, Zephyr Gas Services, is a field services company with quality assets strategically located in highgrowth areas, including the Eagle Ford, Haynesville and Fayetteville shales…
Contract Treating: Competitive Advantages Competitive Advantages Estimated to have 50% of the outsourced treating market share in the Location and Market Share Haynesville Shale Currently expanding treating services into Eagle…
U.S. Treating Market Overview Zephyr is the market leader for larger ( 50 GPM) MODULAR amine plants Estimated Treating Market Share 10 15% 85 90% Zephyr All Other Larger installations ( 50 GPM) typically have longer…
Contract Treating: Opportunities With pipeline market specs of approximately 2%, both Haynesville and lean Eagle Ford gas will require significant CO2 treating infrastructure Shale CO2 /H2S Content Estimated Current Supply…
Financial Overview
Key Finance Objectives Disciplined capital management encompasses the following key items: Strengthen Balance Sheet 1 2 M i t i St bl C h Fl Maintain Stable Cash Flows Maximize Return on Invested Capital 55
Strengthen Balance Sheet: Strong Liquidity Position Our liquidity remains strong, with nearly 500 million currently available to fund our planned growth capital expenditures, including a portion of our ownership interest in the LDH…
Strengthen Balance Sheet: Debt Maturity Profile During 2010, we improved our debt profile through a series of capital markets transactions The weighted average maturity of our debt is six years, with no debt maturing in the next three…
Strengthen Balance Sheet: Disciplined Capital Market Activity Our 408 million equity offering in August 2010 helped delever our balance sheet and positioned us strongly amongst our peer group As of December 31, 2010, our…
Strengthen Balance Sheet: Balancing Distribution Growth with Retaining DCF Our target is a 1.1x coverage ratio, which provides a reasonable margin against earnings variability given our current asset mix 2010 Distributable Cash…
Maintain Stable Cash Flows: Diverse Portfolio Our target is to achieve and retain over 80% of feebased adjusted segment margin Adjusted Total Segment Margin FY 2008 FY 2009 FY 2010 FY 2011E 2% 3% 3% 17% 12% 27% 21% 19%…
Maintain Stable Cash Flows: Comprehensive Hedging Program We utilize a comprehensive hedging program to mitigate exposure NGL Equity Production vs. Hedged 5,000 4,000 Bbl/d 3,000 87% 89% 75% 89% 86% 2 000 2,000 63% B…
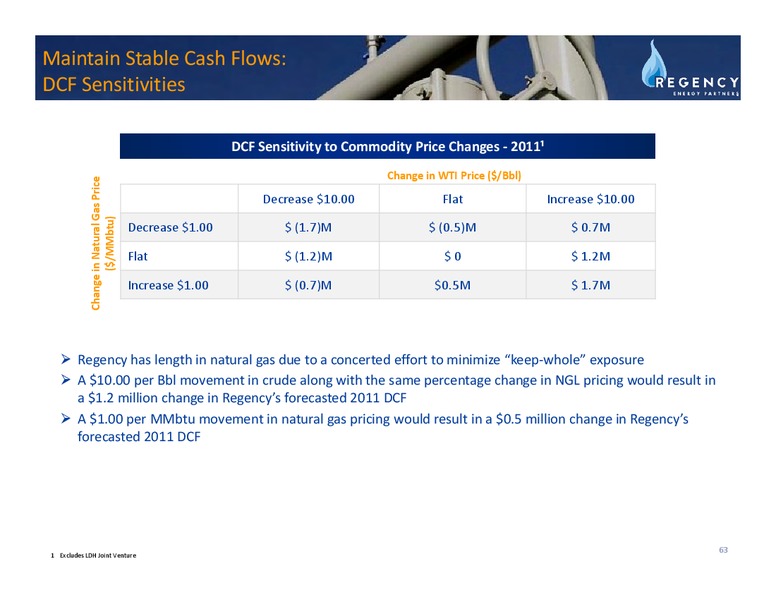
Maintain Stable Cash Flows: DCF Sensitivities DCF Sensitivity to Commodity Price Changes 2011 Change in WTI Price (/Bbl) Change in Natural Gas Price Decrease 10.00 Flat Increase 10.00 /MMbtu) Decrease 1.00 (1.7)M (0.5)M…
Maximize Returns: Track Record of Growth Solid track record of growth through acquisitions and organic growth projects StepOut BoltOn Acquisitions Acquisitions Organic Growth Total iin millions illi iin millions illi iin…
Capital Expenditures Growth Capital 2011 base capital expenditures are expected to be 253 million, allocated across the following segments: Gathering & Processing = 155 million Contract Compression = 78 million Contract Treating =…
Maximize Returns: Cost of Capital Analysis Regencys current cost of capital provides a strategic advantage when pursuing growth opportunities Cost of Capital at 50/50 Debt/Equity Split Cost of Capital at 50/50 Debt/Equity Split…
Conclusion
Concluding Thoughts Regency has a strong foundation that extends across the midstream value chain Portfolio strategically located to take advantage of multiple organic growth and acquisition opportunities in several of the most…
Appendix
Gathering & Processing Segment Three Months Ended December 31, 2010 September 30, 2010 June 30, 2010 March 31, 2010 ( in thousands) Gathering and Processing Segment Financial data: Segment margin (1) 52,915 42,723 49,568 50,802…
Transportation Segment The following provides key performance measures for 100% of the Haynesville Joint Venture Three Months Ended December 31,, 2010 September p 30,, 2010 June 30,, 2010 March 31,, 2010 ( in thousands)…
Contract Compression Segment Three Months Ended December 31, 2010 September 30, 2010 June 30, 2010 March 31, 2010 ( in thousands) Contract Compression Segment (1) Financial data: Segment margin 40,855 38,510 37,814 37,030 Operating…
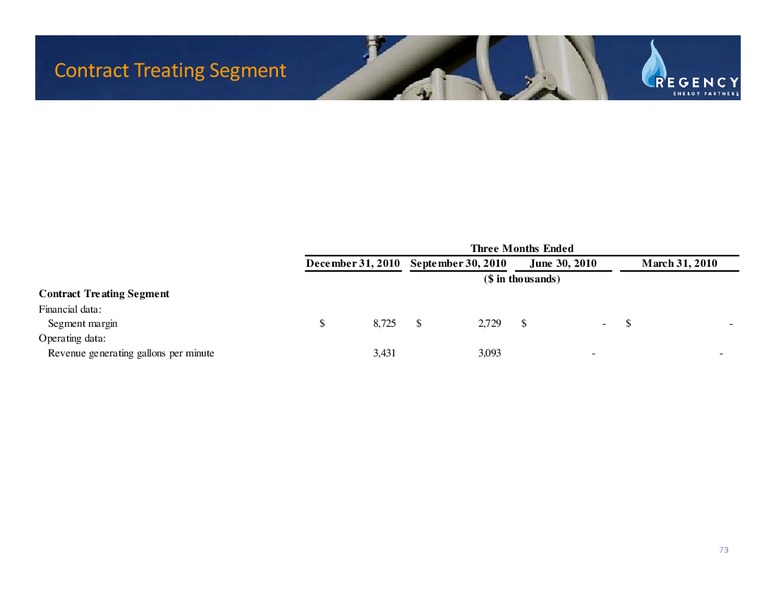
Contract Treating Segment Three Months Ended December 31, 31 2010 September 30 30, 2010 June 30 30, 2010 March 31, 31 2010 ( in thousands) Contract Treating Segment Financial data: Segment margin 8,725 2,729 - - Operating…
NonGAAP Reconciliation Three Months Ended December 31, 2010 September 30, 2010 June 30, 2010 March 31, 2010 ( in thousands) Net (loss) income (8,923) 7,846 (9,391) (450) Add: Interest expense, net 19,791 20,393 22,223 20,564…
NonGAAP Reconciliation Year Ended December 31, 2010 2009 2008 ( in thousands) Net (loss) income (10,918) 140,489 101,328 Add (deduct): Interest expense, net 82,971 77,996 63,243 Depreciation and amortization 122,725 109,893…
NonGAAP Reconciliation Year Ended December 31, 2010 2009 2008 ( in thousands) Net (loss) income (10,918) 140,489 101,328 Add (Deduct): Operation and maintenance 125,650 117,080 119,715 G Generall andd administrative d i i t ti 80…
NonGAAP Reconciliation Three Months Ended December 31, 2010 ( in thousands) Net cash flows provided by operating activities 41,304 Add (deduct): Depreciation and amortization, including debt issuance cost amortization (34,556)…
 Loading...