B siness O Business Overview er ie & Strateg Strategy
Regency Overview Business Overview Midstream energy partnership engaged in gathering & processing, contract compression and transportation of natural gas and natural gas liquids (NGLs) Operations divided into three primary…
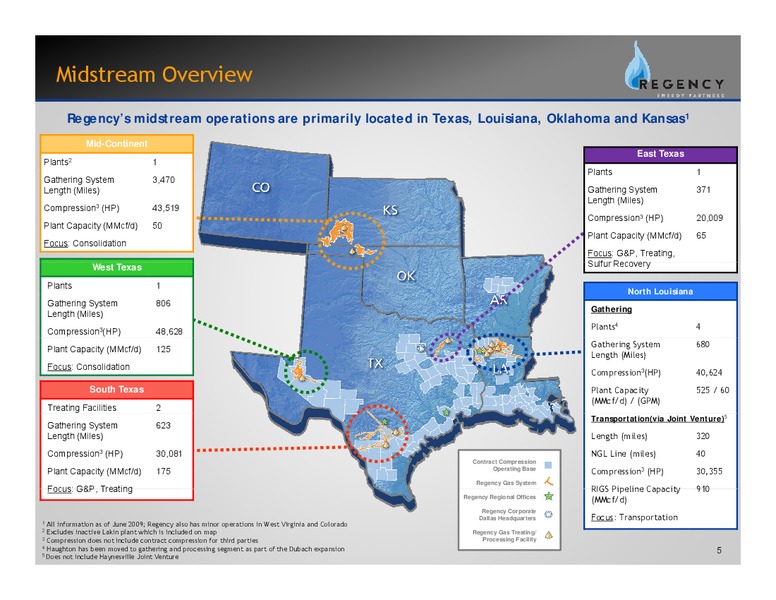
Midstream Overview Regencys midstream operations are primarily located in Texas, Louisiana, Oklahoma and Kansas1 Mid-Continent East Texas Plants2 1 Plants 1 Gathering System 3,470 Length (Miles) Gathering System 371 Length (Miles)…
Contract Compression Overview Core compression operations in Texas, Louisiana and Arkansas HP by Region,2 State Total HP of Units Southwest (TX) 178,973 232 Southeast (LA & TX) 119,277 144 Northwest (TX) 144,592 212 Northeast…
Year-To-Date Highlights Key Accomplishments Year-To-Date for 2009 Delivered financial results in line with management expectations despite a continued decline in rig counts and softness in commodity pricing Second quarter combined…
Strategy Regency's long-term goal is to achieve an investment grade rating Capitalize p on strategic g p position and g grow: Location Obtain Scale in Business Segments Product range across all sectors Reliability…
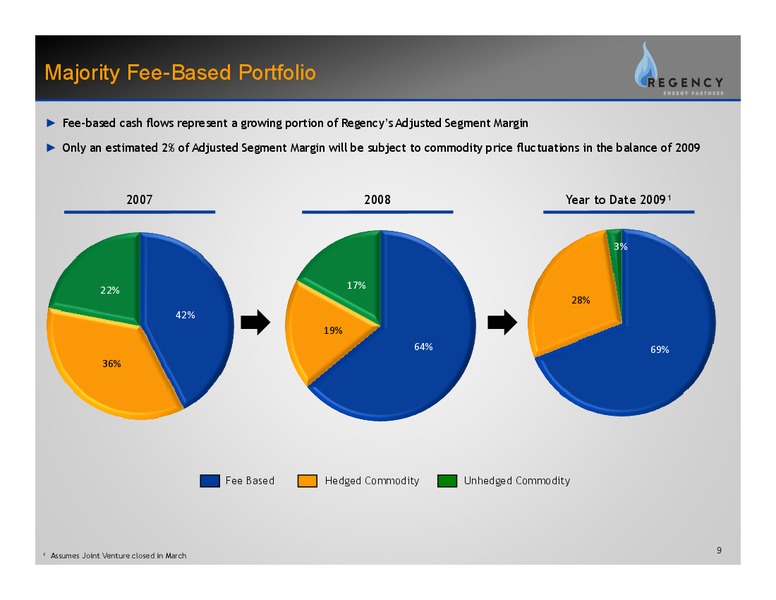
Majority Fee-Based Portfolio Fee-based cash flows represent a growing portion of Regencys Adjusted Segment Margin Only an estimated 2% of Adjusted Segment Margin will be subject to commodity price fluctuations in the balance of…
Industry Update
General Industry Trend Drilling Activity In the past 12 months, the total US land rig count declined by approximately 56% to 932 rigs at the end of the second quarter. The land rig count for the areas in which Regency operates…
General Industry Trend Commodity Prices Over the first half of 2009, gas and NGL prices have stabilized, while we have begun to see a rebound in WTI crude Gas Price Trends Crude / NGL Price Trends 12.00 140.00 10.00 120.00…
Historical Horsepower Growth vs. US Rig Count Despite a 47% decline in the US onshore gas rig count since June 2008, Regencys revenue generating horsepower has increased by 15% over the same period Revenue Generating Horsepower vs. US…
Business Review
Second Quarter Highlights Second quarter performance was in-line with managements expectations and management reiterates Regencys combined adjusted EBITDA guidance range of 220 - 240 million for 2009 2009 Outlook ( in millions) Six…
Quarter-Over-Quarter Performance Combined Adjusted EBITDA 60 55 56 Q2 combined adjusted total segment margin was up by 0.2 million 50 compared to Q1 40 in millions Remaining improvement in EBITDA 30 driven by continued…
Volume Comparisons Transportation and Gathering & Processing volumes were down quarter-over-quarter but have demonstrated resilience on a year-over-year basis Gathering & Processing Throughput TransportationThroughput 1,200…
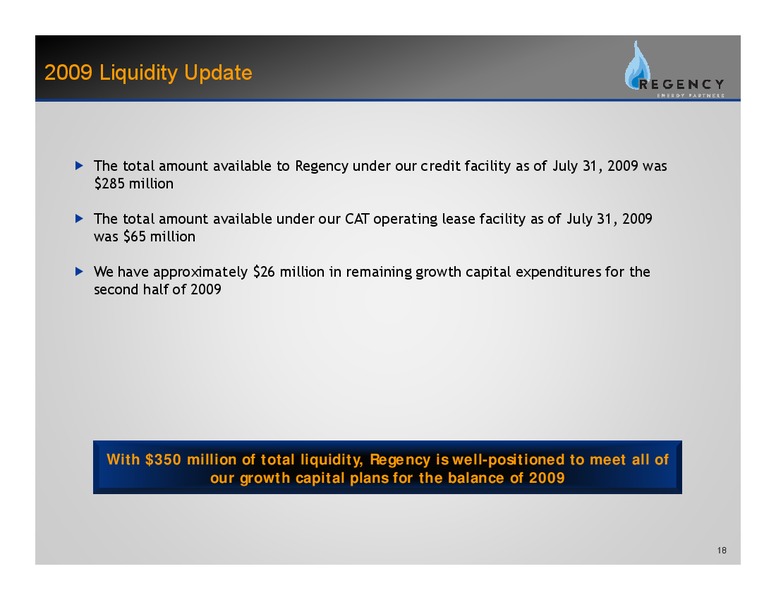
2009 Liquidity Update f The total amount available to Regency under our credit facility as of July 31, 2009 was 285 million f The total amount available under our CAT operating lease facility as of July 31, 2009 was 65 million f…
Commodity Price Risk Management During the second quarter, Regency significantly increased its 2010 hedge position and has begun to layer in swaps to mitigate our 2011 commodity price exposure Executed Hedges by Product: 2009 2010…
Strong Foundation 2009 DCF Analysis DCF Sensitivity to Commodity Price Changes - 2009 Change in WTI Price (/bbl) Change in Natural Gass ( in millions) Decrease 10.00 Flat Increase 10.00 e (/MMbtu) Decrease 1.00 (0.5) (0.3)…
Year-to-Date Business Summary Through the first half of the year, Regency has delivered financial results in line with our expectations by diligently managing our diversified portfolio of assets Our businesses continue to perform in…
Haynesville Shale and Joint Venture Update
Overview of Haynesville Expansion Project R Regency, as operator, iis expanding di RIGS significantly i ifi l to capitalize i li on d development l iin the h HHaynesville ill Sh Shale l f Project adds 1.1 Bcf/d of incremental…
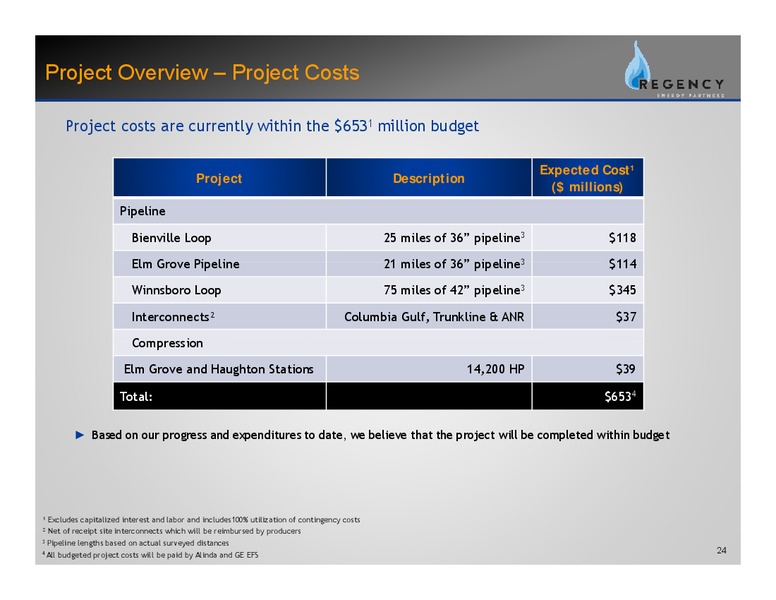
Project Overview Project Costs Project costs are currently within the 6531 million budget Expected Cost Project Description ( millions) Pipeline Bienville Loop 25 miles of 36 pipeline3 118 Elm Grove Pipeline 21 miles of 36…
Haynesville Well Initial Production Rates Average IP rates for the second quarter to date were 11 11.5 5 MMcfe/d MMcfe/d, with 110 working rigs in the Haynesville area Project favorably positioned for future expansion to meet growing…
Construction Update Pipeline Construction Status 36 Pipe Construction 36 Pipe Construction 42 Pipe Construction Elm Grove Line Bienville Loop Construction C t ti Commenced C d iin M May Commenced C d in i MMay Commenced C d…
Overview of Logansport Expansion Regency is constructing the 44 million Logansport Expansion Expansion, an extension of the Nexus Gathering System in North Louisiana f The project will increase overall deliverability of Nexus Gathering…
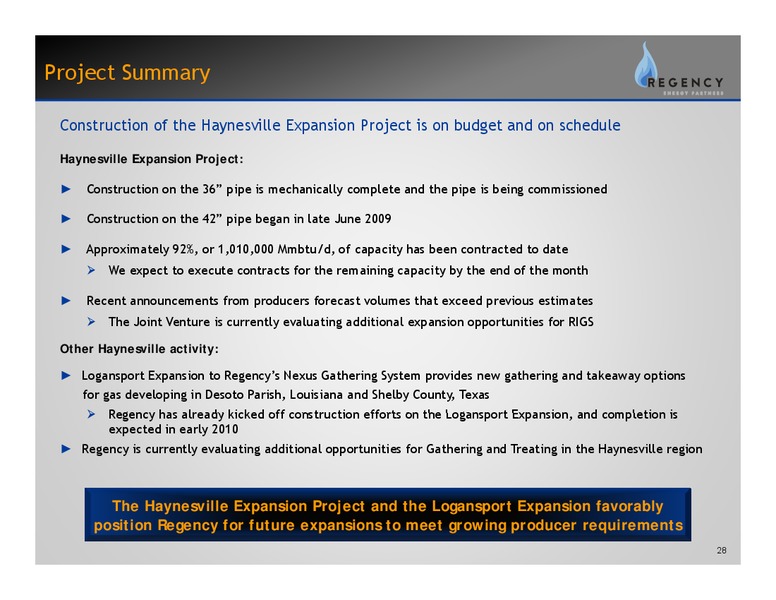
Project Summary Construction of the Haynesville Expansion Project is on budget and on schedule Haynesville Expansion Project: Construction on the 36 pipe is mechanically complete and the pipe is being commissioned Construction on…
Reconciliations
Consolidated Operating Results Regency Energy Partners LP Condensed Consolidated Income Statements Unaudited ( in thousands) Three Months Ended June 30, 2009 March 31, 2009 REVENUES Gas sales 106,897 147,896 NGL sales 57,676…
Gathering and Processing Segment Three Months Ended June 30, 2009 March 31, 2009 ( in thousands) Gatheringg and Processing g Segment g Financial data (1): Segment margin 58,378 58,676 Adjusted segment margin 55,650 55,111…
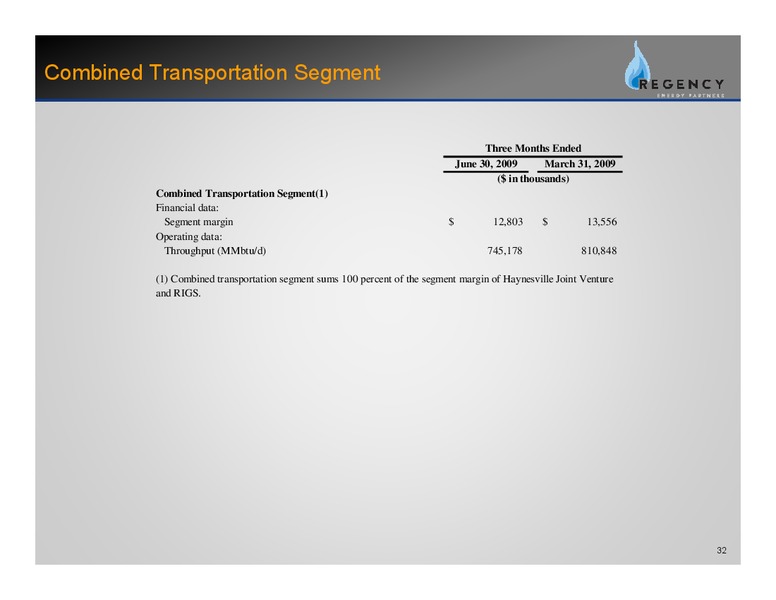
Combined Transportation Segment Three Months Ended June 30, 2009 March 31, 2009 ( in thousands) Combined Transportation Segment(1) Financial data: Segment margin 12,803 13,556 Operating data: Throughput (MMbtu/d) 745,178…
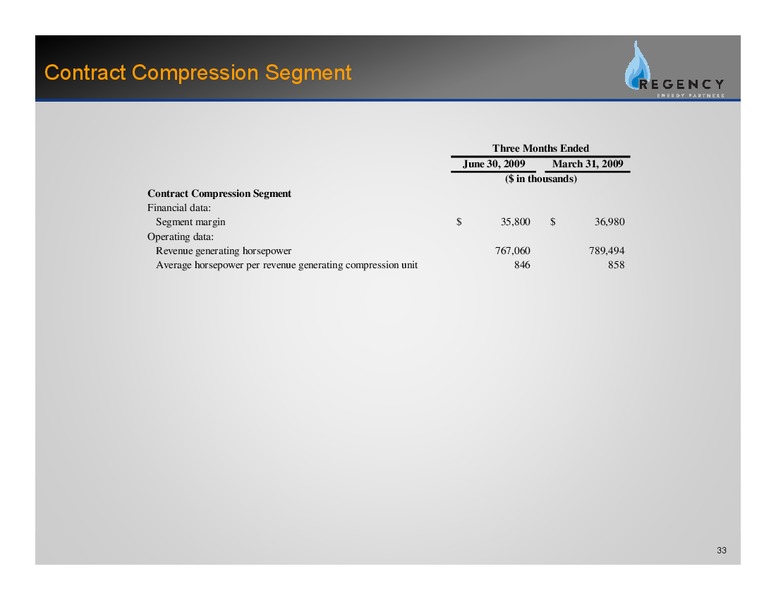
Contract Compression Segment Three Months Ended June 30, 2009 March 31, 2009 ( in thousands) Contract Compression Segment Financial data: Segment margin 35,800 36,980 Operating data: Revenue generating horsepower 767,060…
Non-GAAP Reconciliation Three Months Ended June 30, 2009 March 31, 2009 ( in thousands) Net income attributable to Regency Energy Partners LP 5,890 148,389 Income tax expense (benefit) (515) 100 Interest expense, net 19,568 14,227…
Non-GAAP Reconciliation Three Months Ended June 30, 2009 March 31, 2009 ( in thousands) Net income 5,955 148,424 Add (Deduct): Operation p and maintenance 31,974 36,042 General and administrative 14,127 15,078 Loss (gain) on…
Non-GAAP Reconciliation1 Three Months Ended June 30, 2009 March 31, 2009 ( in thousands) Adjusted Total Segment Margin 93,467 103,885 Adjusted Total Segment Margin for HPC (a) 12,643 2,002 Combined Adjusted Total Segment Margin…
Non-GAAP Reconciliation Three Months Ended June 30, 2009 ( in thousands) Net cash flows provided by operating activities 32,940 Add (deduct): Depreciation p and amortization,, including g debt issuance cost amortization…
Non-GAAP Reconciliation Low Estimate High Estimate ( in thousands) Forecasted net income 162,212 176,212 Add(Deduct): ( ) Gain on sale of RIGS (133,940) (133,940) Gain from risk management activites 2,728 2,728 Depreciation and…
 Loading...