Regency Energy Partners RBC MLP Conference Panel November 18, 2010
Forward-Looking Statements Certain matters discussed in this report include forward-looking statements. Forward-looking statements are identified as any statement that does not relate strictly to historical or current facts. Statements…
Regency Energy and the Haynesville Shale
Regency Asset Overview: A Diverse Portfolio Regency has strategically positioned assets in key shale plays, including the Haynesville and Eagle Ford shales Regency Asset Map Asset Summary 1 Gathering Pipeline 5,252 miles…
Regency is a Full-Service Midstream Provider From the wellhead to market, Regency offers a full range of midstream natural gas services, including contract compression, treating, gathering and processing, transportation and marketing of…
Haynesville Joint Venture (RIGS) Overview Haynesville Joint Venture (RIGS) Partnership Structure RIGS Details Regency Energy Partners 49.99% Capacity / 2.1 Bcf/d Pipeline Length 450 miles GE Energy Financial Services .01% Alinda…
Transportation Segment: RIGS Expansion Volume The 121-mile Haynesville Expansion and Red River Lateral projects, completed in January, added an incremental 1.2 Bcf of capacity to our existing system Volumes have continued to ramp up…
Gathering & Processing Segment: Logansport Expansions Regency recently completed expansions to our Logansport system, increasing incremental gathering capacity by 485 MMcf/d Key Regency Gathering & Processing Assets in North…
Contract Services Segment: Zephyr Acquisition Regency acquired Zephyr Gas Services on September 1, 2010 Zephyr Asset Overview Texas/Louisiana Amine Plants 30 Gas Coolers 77 JT Plants 6 NGL Storage Tanks 8 Other Equipment…
Haynesville: Current Status
Haynesville Drilling Activity Natural gas prices have hovered between 4 and 5/MMbtu during the summer In the past month, prices have dipped below 4 Rig counts in the Haynesville Shale have begun to decline from a record high in the…
Opportunities for Compression and Treating Type Curve by Month 15,000 (Illustrative Example) Haynesville Type Curve Regency expects the 12,000 Treating Haynesville and Eagle Ford Services shales to be leading growth Required…
Haynesville: Looking Forward
Haynesville Competitiveness Haynesville is among the lowest cost shales The breakeven gas price for shale plays is substantially lower than the average conventional play North America Producing Basins (Ranked By Cost) 7.00 6.60…
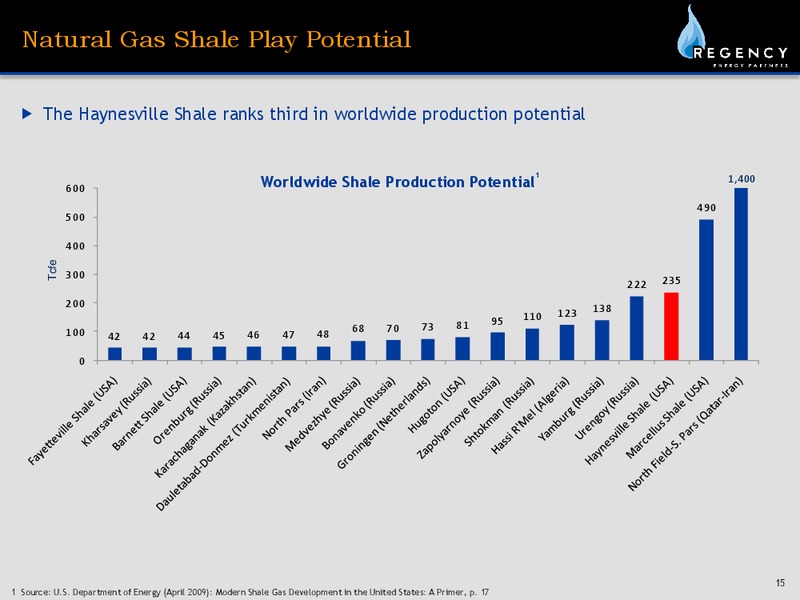
Natural Gas Shale Play Potential The Haynesville Shale ranks third in worldwide production potential 1 600 Worldwide Shale Production Potential 1,400 490 500 400 Tcfe 300 235 222 200 138 110 123 81 95 100 68 70 73…
 Loading...