First Quarter 2015 Investor Review Presented May 6, 2015 1
Summary of Q1 Results Q1 revenue of 732.5 million, down 13% from prior year with Lodging and Oil & Gas accounting for majority of decline Q1 Adjusted EBITDA* of 78.3 million; Adjusted EBITDA margin of 10.7%, down 130 basis points,…
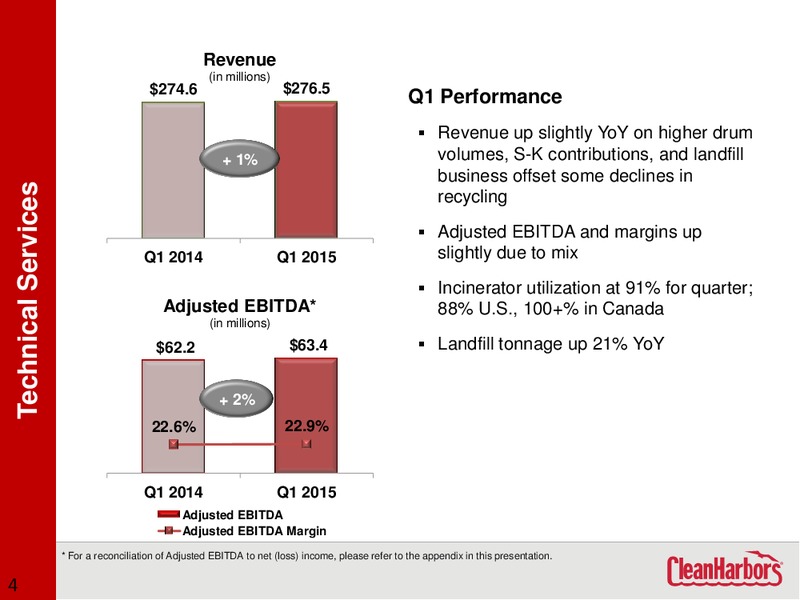
Revenue (in millions) 274.6 276.5 Q1 Performance Revenue up slightly YoY on higher drum + 1% volumes, S-K contributions, and landfill business offset some declines in Technical Services recycling Adjusted EBITDA and margins…
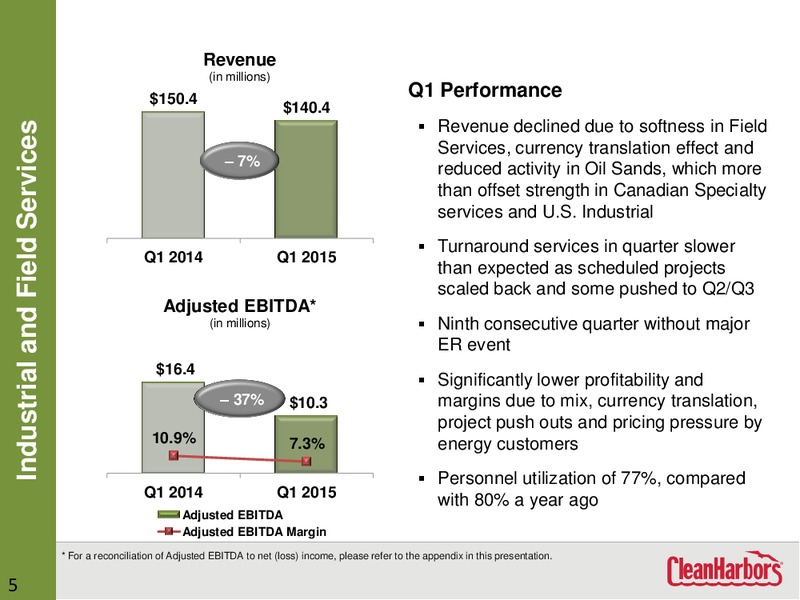
Revenue (in millions) 150.4 Q1 Performance 140.4 Revenue declined due to softness in Field Industrial and Field Services Services, currency translation effect and 7% reduced activity in Oil Sands, which more than offset…
Outside Revenue (in millions) 128.9 96.8 Q1 Performance 25% Oil Re-refining and Recycling Outside revenue down 25% due to YoY Q1 2014 Q1 2015 change in base oil and blended pricing; direct revenue down slightly Direct…
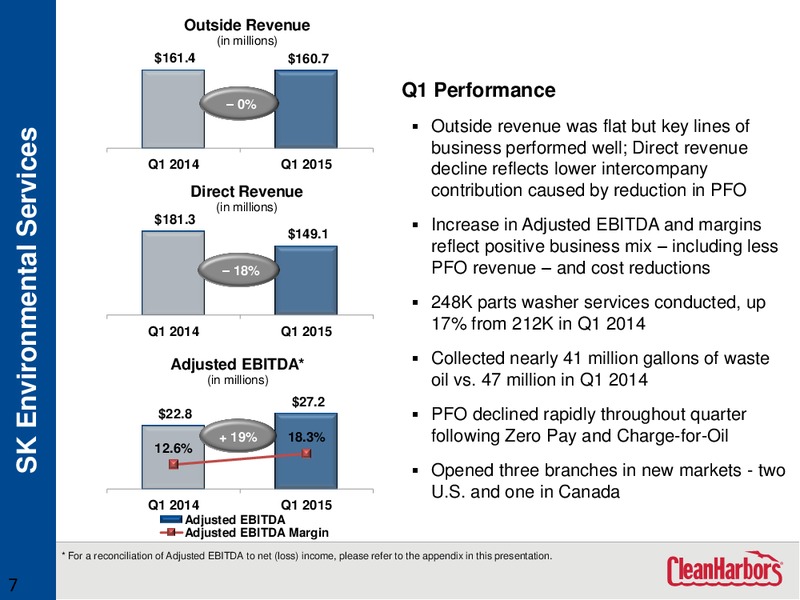
Outside Revenue (in millions) 161.4 160.7 Q1 Performance 0% Outside revenue was flat but key lines of SK Environmental Services business performed well; Direct revenue Q1 2014 Q1 2015 decline reflects lower intercompany…
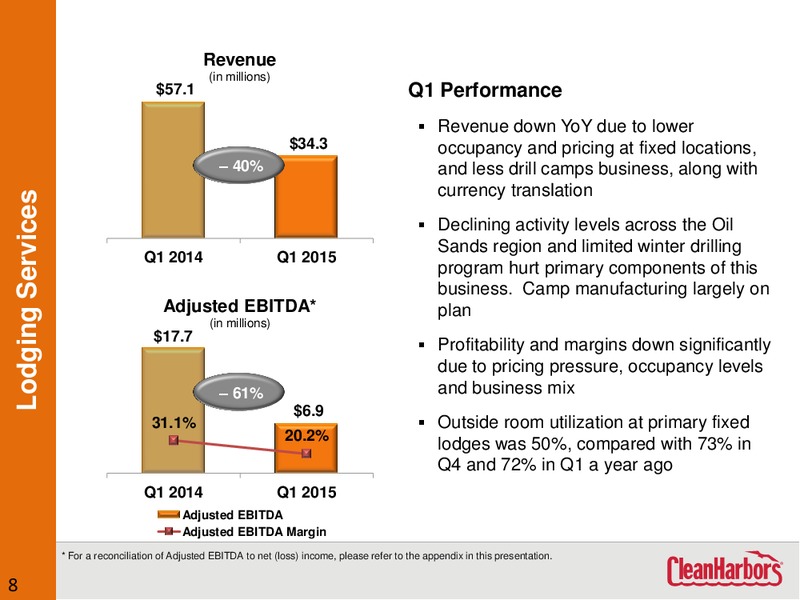
Revenue (in millions) 57.1 Q1 Performance Revenue down YoY due to lower 34.3 occupancy and pricing at fixed locations, 40% and less drill camps business, along with currency translation Lodging Services Declining activity…
Revenue (in millions) Q1 Performance 102.9 Revenue decline greater than expected as downturn in energy markets Oil and Gas Field Services 54.9 accelerated during quarter 47% Seismic affected by more budget cuts and project…
Corporate Update Expanded carve-out to include all of Lodging Services segment Want to maximize shareholder value Splitting segment not in best interest of customers and shareholders Carve-out prepared to go public early next…
Capital Allocation Strategy Three key elements: Organic Growth Share Acquisitions Investments Repurchases Mix will be determined on a relative basis by: performance, price, risk, opportunity and cost of capital Will deploy…
Outlook Technical Services Extending disposal momentum at both incinerators and landfills Pursuing large remediation projects to drive volumes into our network Proceeding with construction of new El Dorado incinerator Industrial…
Outlook SK Environmental Services Opening new branches or co-locating with existing Field Services locations Driving average PFO down further while maintaining sufficient volumes Integrating TFI by optimizing network and…
Financial Review 14
Key Verticals Performance in Q1 2015 (% of total Q1 revenue) Refineries and Oil Sands Other 2%1%1% 1% Chemical 2% 2% General Manufacturing 3% 4% 14% Base Oil/Blenders/Packagers 4% Automotive 4% Oil and Gas Production 14% 4%…
Reporting Segments Q1 Direct Revenue (In millions) Technical Services Oil and Gas 38% Field Services 7% 276.5 54.9 Lodging Services 5% 34.3 149.1 140.4 Industrial and 78.5 Field Services SK Environmental 19% Services…
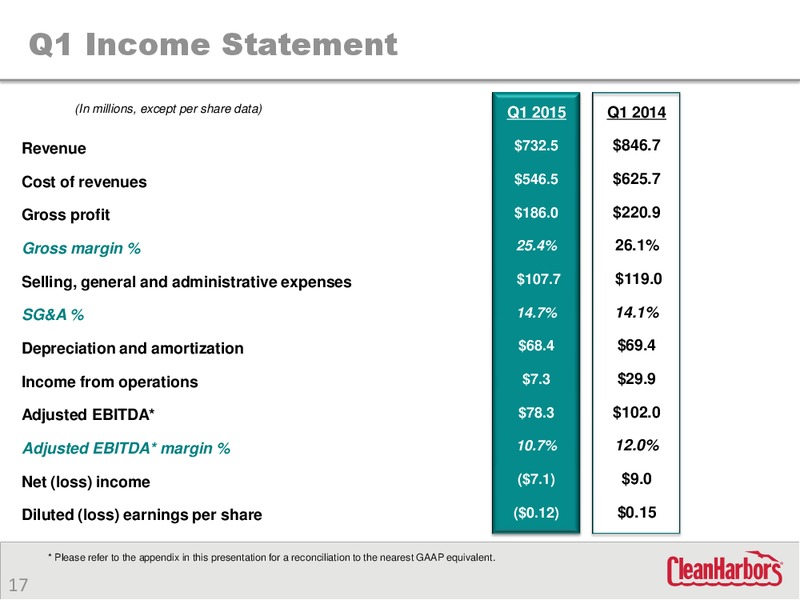
Q1 Income Statement (In millions, except per share data) Q1 2015 Q1 2014 Revenue 732.5 846.7 Cost of revenues 546.5 625.7 Gross profit 186.0 220.9 Gross margin % 25.4% 26.1% Selling, general and administrative expenses 107.7…
Balance Sheet and Cash Flow Highlights (In millions) 3/31/15 12/31/14 Balance Sheet Highlights Cash and marketable securities 233.7 246.9 Accounts payable 244.2 267.3 Billed and unbilled receivables 554.9 597.9 Days sales…
Guidance (as of May 6, 2015) Q2 2015 Range Adjusted EBITDA* (in millions) 138 145 2015 Range Adjusted EBITDA* (in millions) 530 570 * For a reconciliation of Adjusted EBITDA to net income, please refer to the appendix in…
Questions & Answers 20
Appendix 21
Non-GAAP Reconciliation For the Three Months Ended: (in thousands) March 31, 2015 March 31, 2014 (7,089) 8,960 Net (loss) income 2,619 2,724 Accretion of environmental liabilities 68,356 69,356 Depreciation and amortization…
Non-GAAP Reconciliation For the Quarter Ending For the Year Ending June 30, 2015 December 31, 2015 Amount Amount (In millions) (In millions) Projected GAAP net income 29 to 36 101 to 134 Adjustments: Accretion of environmental…
 Loading...