Agenda I. We have responded positively to the challenges posed by the oil price environment by: Making prudent investments ahead of our peers Reducing risks and increasing profitability through further integration Constant…
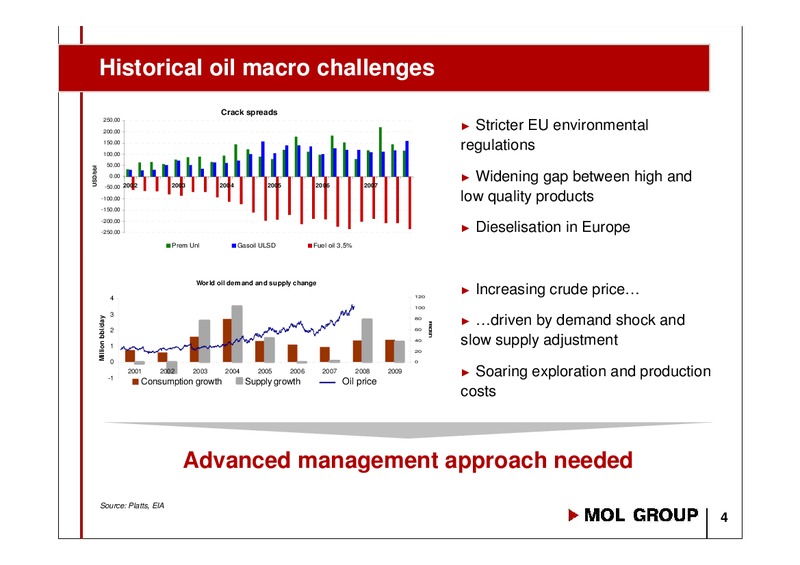
Historical oil macro challenges Crack spreads 250,00 200,00 Stricter EU environmental 150,00 100,00 regulations 50,00 USD/bbl 0,00 Widening gap between high and -50,00 2002 2003 2004 2005 2006 2007 -100,00 low quality…
Our response: solid downstream strategy Investment in time Integration Focus on efficiency Continuous efforts on Refinery upgrade and Efficiency gain through the efficiency improvement dieselisation supply chain Headcount…
complemented by our upstream strategy Ability to work with Portfolio Technical excellence Efficiency partners development Experience in asset Successful partnership Headcount optimisation Russian acquisitions management with INA,…
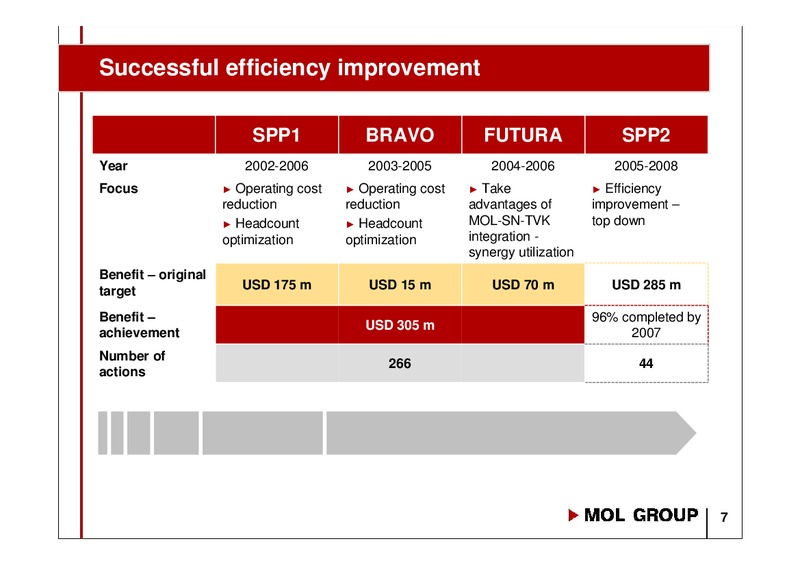
Successful efficiency improvement SPP1 BRAVO FUTURA SPP2 Year 2002-2006 2003-2005 2004-2006 2005-2008 Focus Operating cost Operating cost Take Efficiency reduction reduction advantages of improvement Headcount Headcount MOL-SN-TVK…
Track record of outstanding operating profitability In HUF bn MOLs EBIT Development (excluding one-off items)* 350 300 250 200 150 100 50 0 2003 2004 2005 2006 2007 *Operating profit excludes the one-off gain and…
MOL has continuously outperformed its peers Superior ROACE1 maintained 25 20 15 % 10 5 0 2003 2004 2005 2006 2007 MOL OMV PKN MOL average 2003-2007 OMV average 2003-2007 PKN average 2003-2007 1) ROACE:…
Over time, MOL has become the industry benchmark Upstream Net Income per boe Downstream Net Income per bbl (USD/boe) (USD/boe) 30 7 6 25 5 20 4 15 3 10 2 5 1 0 0 2002 2003 2004 2005 2006 2004 2005 2006 2007 -5 MOL…
0 2 4 6 8 10 12 /bbl MOL Neste Oil PKN Orlen SA PdVSA Saras Grupa LOTOS Repsol YPF Source: Wood Mackenzie CRC LUKOIL Cepsa Eni Shell OMV Galp Energia BP Total Hellenic Petroleum ERG KPI ExxonMobil Tpras…
Growth strategy successfully pursued in 2007 Upstream Downstream New Russian acquisition: Matjushkinskaya Successful acquisitions: Intensive field development IES 50% exploration success rate Tifon Highly competitive OPEX…
Dramatic changes in oil mega trends over the last years Increasing resource nationalism strengthens the host government/NOC Resource positions irreversibly constraints Worries over security of supply drives government policies and…
and our smart answers Unconventional EOR / IOR / EGR exploration Resource From oil industry to constraints energy industry Geothermal energy Partnership with assets and resource holders Global Security of Advanced biodiesel…
Three pillars of our growth Partnership Find appropriate partner with complementary skills and activities MOLs Organic growth growth EBITDA growth target of 6.5% path M&A CAGR for 2006-2011 driven by Committed to continuing to…
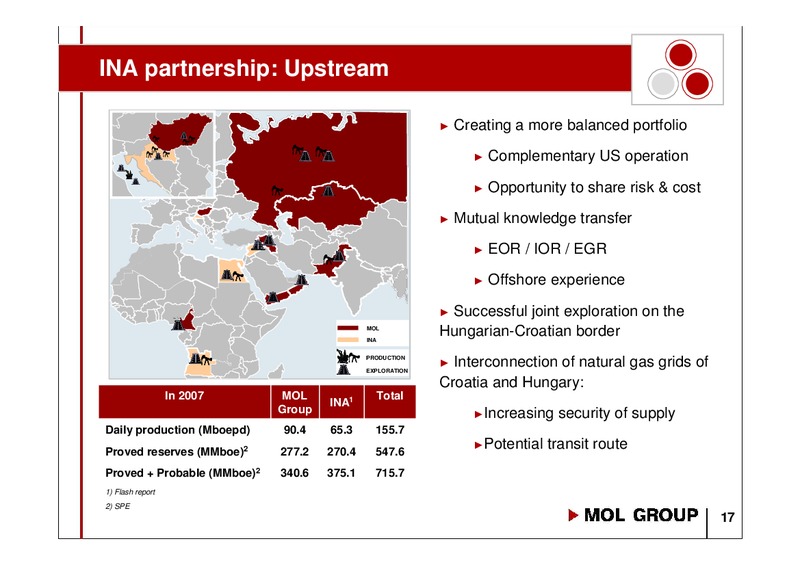
INA partnership: Upstream Creating a more balanced portfolio Complementary US operation Opportunity to share risk & cost Mutual knowledge transfer EOR / IOR / EGR Offshore experience Successful joint exploration on the…
INA partnership: Downstream DUNA Extension of supply radius Capacity: 8.1 mtpa NCI: 10.6 BRATISLAVA Capacity: 6.1 mtpa NCI: 11.5 Mantova - IES Capacity: 2.6 mtpa NCI: 8.4 RIJEKA Capacity: 4.5 mtpa NCI: 5.8 SISAK Capacity:…
CEZ Further integration along our supply chain EBIT breakdown of a horizontally integrated European Benefits electricity and gas player Significant EBIT contribution as of 2013 Additional synergies on enhanced energy integration…
ExxonMobil - unconventional exploration MOL-ExxonMobil strategic partnership relies on synergies based on MOLs understanding of local MOL-ExxonMobil Derecske geology Strategic Joint Venture Basin MOLs acreage position in the…
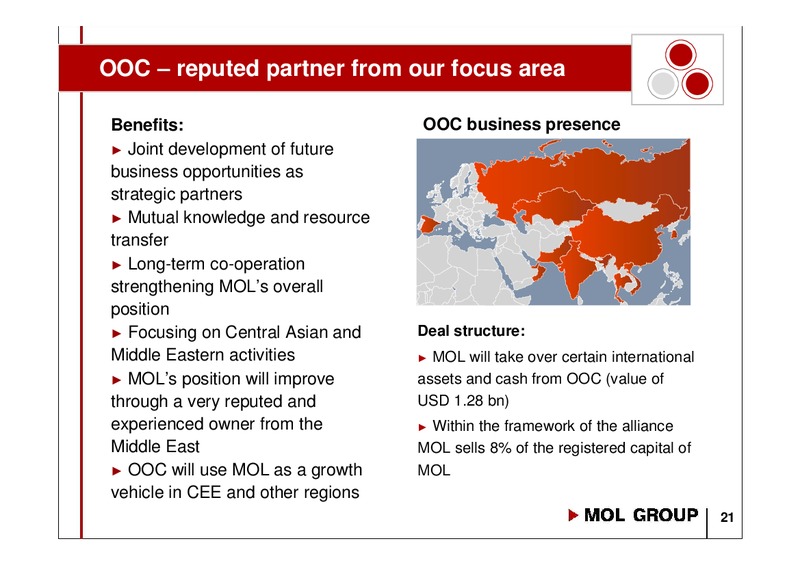
OOC reputed partner from our focus area Benefits: OOC business presence Joint development of future business opportunities as strategic partners Mutual knowledge and resource transfer Long-term co-operation strengthening MOLs…
NETS Regional value creative cooperation CZ UA D SK H A RO I SLO HR BiH N AB UC SER CO LN BG G Market discrepancies NETS as a solution Inadequate energy security Increasing supply route diversification…
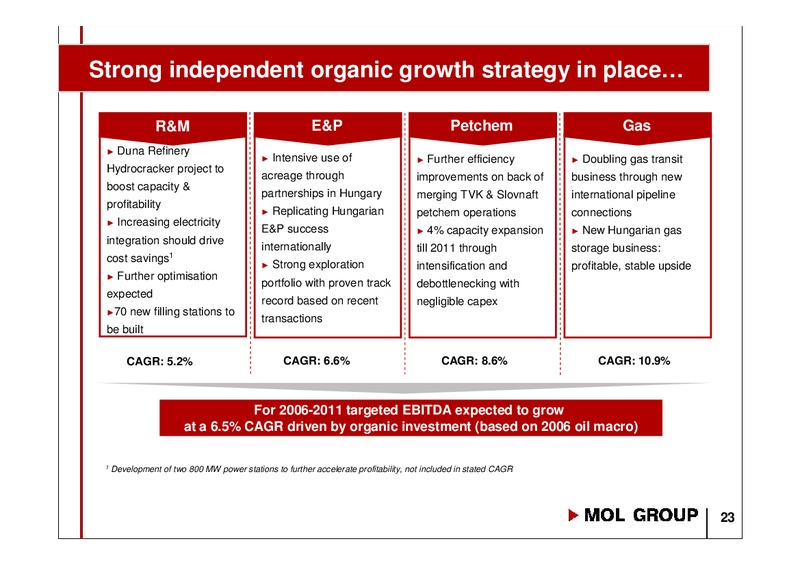
Strong independent organic growth strategy in place R&M E&P Petchem Gas Duna Refinery Intensive use of Further efficiency Doubling gas transit Hydrocracker project to acreage through improvements on back of business through new…
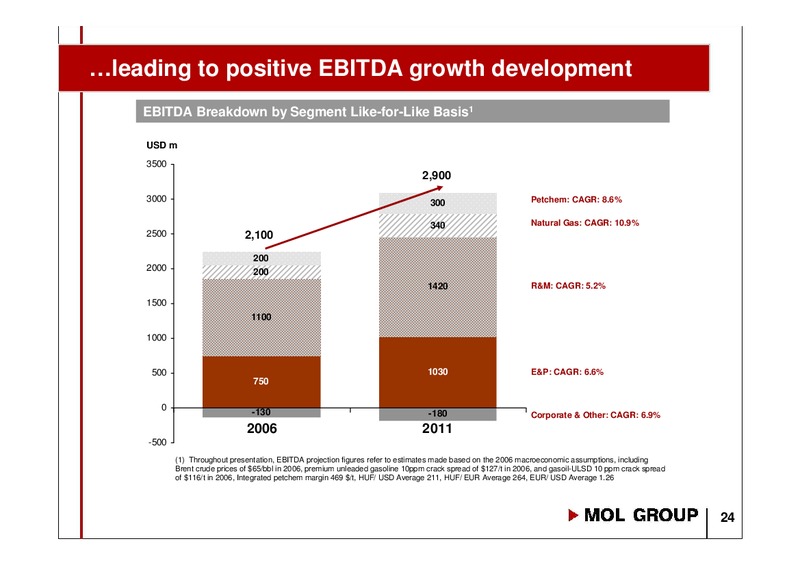
leading to positive EBITDA growth development EBITDA Breakdown by Segment Like-for-Like Basis1 USD m 3500 2,900 3000 Petchem: CAGR: 8.6% 300 340 Natural Gas: CAGR: 10.9% 2500 2,100 200 2000 200 1420 R&M: CAGR: 5.2% 1500…
M&A strategy Downstream Upstream Investigating opportunities in the broader region, including Mediterranean and CIS Our retail strategy is to maintain DS integrity and enhance it through acquisitions Potential Direction of…
Agenda I. We have responded positively to the challenges posed by the oil price environment by: Making prudent investments ahead of our peers Reducing risks and increasing profitability through further integration Constant efforts…
 Loading...