TransAlta Corporation (TSX:TA, NYSE:TAC) 9 billion Power Infrastructure and Energy Marketer with 3.5 billion market capitalization ASSETS CAPABILITIES Marketing and Upside from a Contracted Gas M&A and asset mix of strategic and…
TransAlta Just the Facts Coal: 4,931 MW 88% contracted 6 facilities in Canada and U.S. Remaining contract life of 5.5 years 95% contracted Gas: 1,447 MW Average contract life of 10.9 years 12 facilities in Canada and Australia; also…
Contracted Portfolio Supports Stable EBITDA Total portfolio contractedness MW 69% Merchant exposure in Alberta and the 88% 82% 78% Pacific NW 6,000 2015 Hedge prices 5,000 AB 50/MWh PacNW 40/MWh 4,000 2016 Hedge prices…
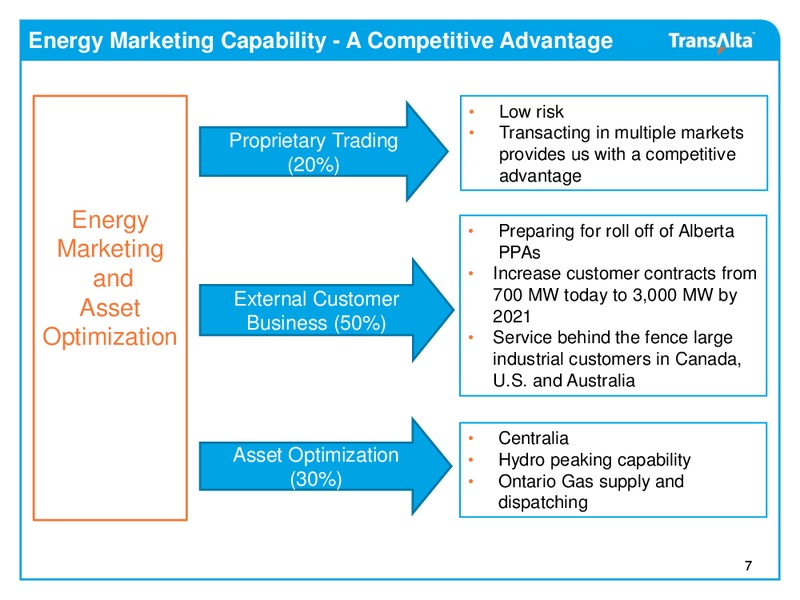
Energy Marketing Capability - A Competitive Advantage Low risk Proprietary Trading Transacting in multiple markets provides us with a competitive (20%) advantage Energy Preparing for roll off of Alberta Marketing PPAs and…
2015 Strategic Objectives TransAltas Strategic Goals Deliver results from the base business Grow profitably Strengthen our financial position 8
Executing on our Strategic Objectives Customer Serve Alberta with diverse energy generation fleet; serve 30% of provincial customers by 2021 Focus Provide customers with reliable and low cost power Leverage world class Energy…
Alberta Market 10
TransAltas Position in the Alberta Market Current By 2020 40% of total generation; 15% of total 30% of total customers under customer business 1 - 5 year contracts 13% of total offer control 30% of total offer control 80%…
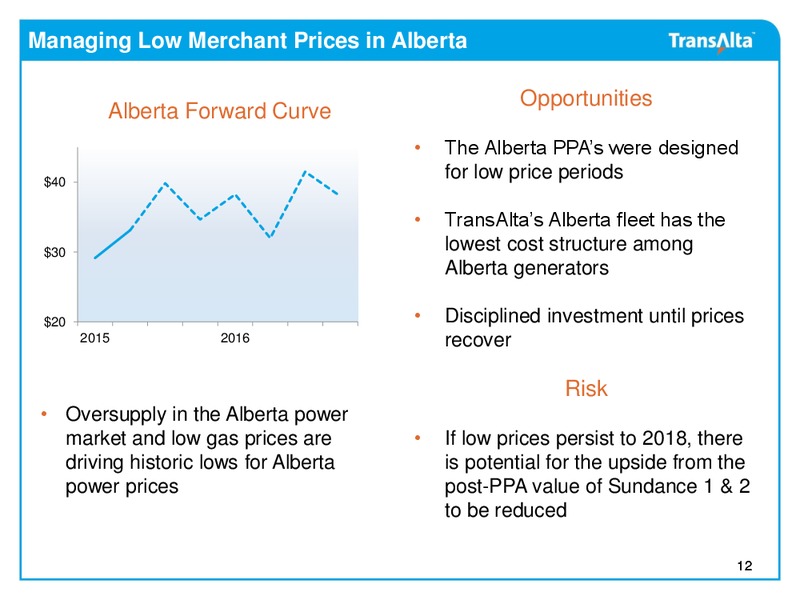
Managing Low Merchant Prices in Alberta Opportunities Alberta Forward Curve The Alberta PPAs were designed 40 for low price periods TransAltas Alberta fleet has the 30 lowest cost structure among Alberta generators 20…
Competitive Position - Low Cost Generation in Alberta /MWh Marginal Costs Customer Representation 60 50 40 TransAltas Average 30 Marginal Cost in AB 20 Providing our 10 customers with a competitive and - reliable offering…
Current Low Prices in Alberta Create Opportunities TransAltas goal is to have 30% market share of the Alberta market by 2020 Low-cost asset base TransAlta customer growth enables competitive MW product offerings 3,000 2,500…
Value Potential as Alberta Legislated PPAs Expire TransAlta currently offers 11% of the provinces power supply into the market this will increase to 30% after the full expiry of the Alberta PPAs in 2021 Other TransAlta 15% Other…
Alberta Requires Significant New Investment Longer-term Projected load growth and MW capacity replacement 8,000 Oil and gas sector remains a major 7,000 economic driver even with weaker world oil 6,000 Coal retirements/ Coal…
Near-term Growth Potential Significant incremental EBITDA by 2021 when Alberta PPAs expire M 2,000 1,500 Upside at Upside at 75/MWH Upside at 65/MWH 55/MWH 1,000 500 - 2014 2017E 2018E 2021E Existing Business…
Financial Strength and Funding Strategy 18
Strengthening our Financial Position Why 1 Access to capital markets Competitiveness 2 Lower cost of debt Financial Flexibility 3 Access to customers Growth Agency Rating Outlook All rating agencies have S&P BBB- Stable…
Strengthened Financial Position Long-Term Debt Reduction Initiatives 4,300M -200M 2013 -135M 4,000M Sale of CE Gen Secondary -165M 2014 -215M Offering of RNW Issuance RNW of FFO/Debt Invests in 85M-285M Preferred 16.9%…
Significant Financial Capacity TransAlta aims to raise between 900 million and 1.1 billion over the next 3 years to meet our current funding requirements Committed Funding Requirements (2015 - 2017) millions Low High Debt…
Leveraging TransAlta Renewables TransAlta is the largest shareholder of TransAlta Renewables and will maintain TransAlta Public 70% ownership Unlocks the value of long-life contracted assets on attractive terms 70% 30% Provides…
TransAlta Renewables (TSX:RNW) Created in August 2013 to provide stable, consistent returns for investors through the ownership of highly contracted power generation and other infrastructure assets. 3.4 2.7 176 million in 2014…
Executing the First Step of our Funding Strategy TransAlta Renewables agreed to acquire an economic interest in TransAltas Australian portfolio in March 2015 for 1.8 billion With the closing of the transaction in May 2015, TransAlta has…
Inventory of Drop-Down Opportunities Potential Drop-Down Candidates Gas Fired 1,000 MW in Alberta & Ontario Generation 220 million annual EBITDA 800 MW from 13 units in Alberta Alberta Hydro 60 - 120 million annual EBITDA…
Growth Strategy 26
Growing TransAlta Actively Evaluating 6,700 MW (10 billion) of Growth Opportunities across all of our core markets Opportunity Set (MW) Add customized customer product Behind the Fence Gas Fired offerings Replace Alberta PPAs…
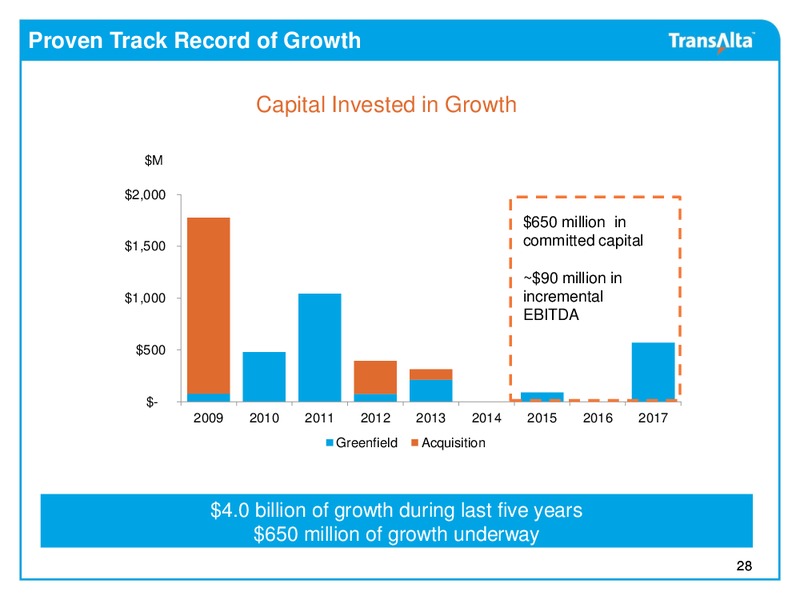
Proven Track Record of Growth Capital Invested in Growth M 2,000 650 million in 1,500 committed capital 90 million in 1,000 incremental EBITDA 500 - 2009 2010 2011 2012 2013 2014 2015 2016 2017 Greenfield…
Growth Strategy Manage volatility in the Alberta market by continuing to Prepare for final grow Customer business from 700 MW to 3,000 MW of stages of customers by 2021 de-regulation in the Alberta Support large industrial customers…
Growth Strategy Capitalize on Find a customer for Centralia 3 locational advantages in Find additional contracts for Centralia Washington State Attract more large Potential to grow large scale utilities through scale utilities…
Capital Allocation Metrics Targeted return will depend on location, technology and stage of construction or development Growth Metrics Metric Operating In Construction Development Stage Range Assets Non-contracted 8 -11% +2%…
Environmental Regulations 32
Environmental Regulations The Facts Canadian federal regulations amended in 2012 designate useful life of coal plants as 50 years Weighted average life of TransAltas Alberta coal fleet is 17 years Flexibility provisions enabling unit…
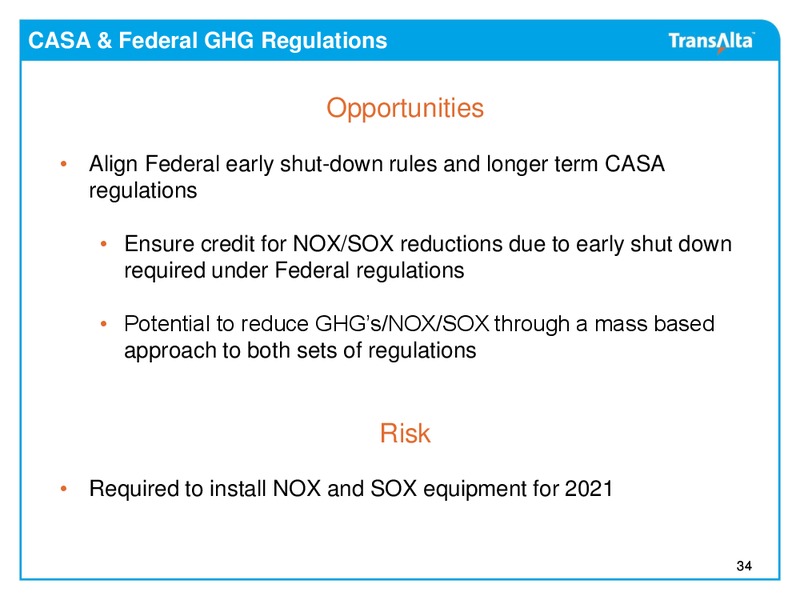
CASA & Federal GHG Regulations Opportunities Align Federal early shut-down rules and longer term CASA regulations Ensure credit for NOX/SOX reductions due to early shut down required under Federal regulations Potential to…
Appendix 35
Highly Diversified Portfolio Diversified asset base with 64 facilities strategically positioned in Canada, Western U.S. and Western Australia One of Canadas largest publicly traded power generators & marketers with over 100 years…
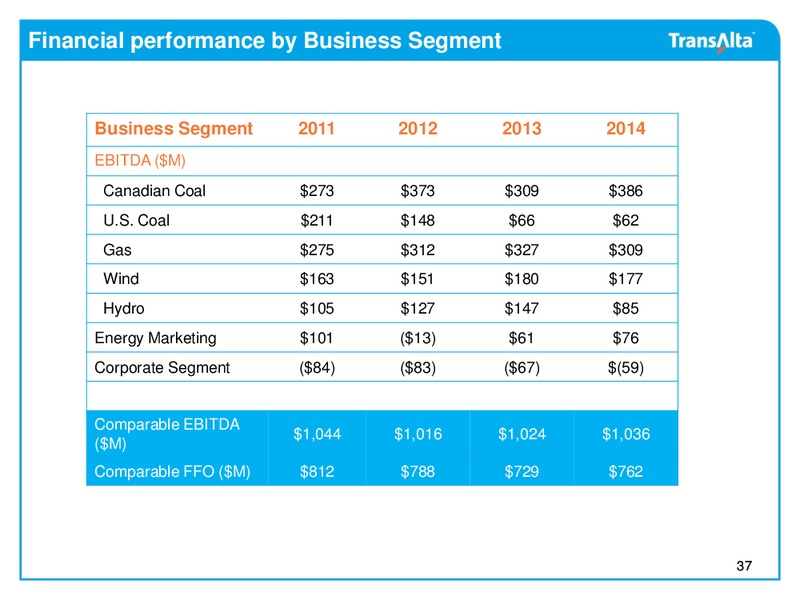
Financial performance by Business Segment Business Segment 2011 2012 2013 2014 EBITDA (M) Canadian Coal 273 373 309 386 U.S. Coal 211 148 66 62 Gas 275 312 327 309 Wind 163 151 180 177 Hydro 105 127 147 85 Energy Marketing 101…
Sustaining Capex by Business Segment Sustaining Capital M Business Segment 2011 2012 2013 2014 Generation Segment Canadian Coal 121 316 237 211 U.S. Coal 63 32 16 12 Gas 69 49 58 63 Wind 7 4 9 12 Hydro 32 14 14 21 Corporate…
Debt Maturity schedule and Liquidity Debt Maturity Schedule M 800 600 400 520 500 200 400 120 27 177 400 0 2015 2016 2017 2018 2019 CAD MTN USD Notes As at March 31, 2015, 1.0 billion in available liquidity and 700…
 Loading...