Regency Energy Partners FirstQuarter 2012 Earnings Release May 9, 2012 Regency Energy Partners LP Investor Day March 28, 2012
FirstQuarter Performance Comparing the first quarter of 2012 to the first quarter of 2011, adjusted EBITDA increased approximately 46% Adjusted EBITDA1 140 134 120 112 115 102 103 100 90 92 in millions 80 74 62…
Gathering and Processing Segment Volumes increased approximately 38% from the first quarter of 2011 to the first quarter of 2012, primarily driven by growth in the Eagle Ford Shale, PermianDelaware Basin and north Louisiana NGL gross…
Joint Ventures Segment Adjusted EBITDA for the Joint Ventures segment increased by 13 million from the first quarter of 2011 to the first quarter of 2012, primarily due to the acquisition of the Lone Star Joint Venture Joint…
Contract Compression Segment Focus has been on resource optimization for producers as they shift drilling programs from drygas to wetgas plays Contract Compression Revenue Generating Horsepower 900 60 800 767 769 777 761 55 754…
Contract Treating Segment Transitioning strategy to place more emphasis on liquidsrich regions Contract Treating Financial Performance 3,600 20 3,431 3,468 3,465 3,368 3,370 18 3,400 3,268 Segment Margin ( in millions)…
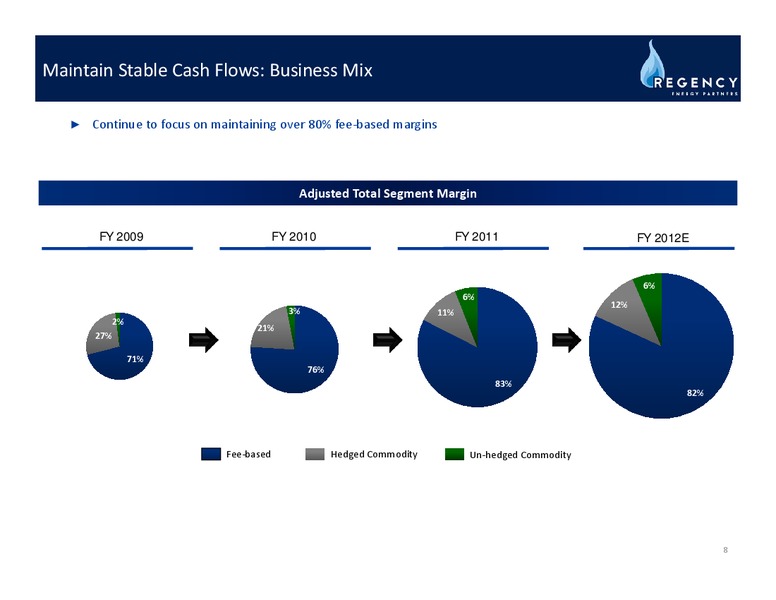
Maintain Stable Cash Flows: Business Mix Continue to focus on maintaining over 80% feebased margins Adjusted Total Segment Margin FY 2009 FY 2010 FY 2011 FY 2012E 6% 6% 12% 3% 11% 2% 21% 27% 71% 76% 83% 82%…
Maintain Stable Cash Flows: DCF Sensitivities DCF Sensitivity to Commodity Price Changes 2012 Change in WTI Price (/Bbl) Change in Natural Gas Price Decrease 10.00 Flat Increase 10.00 (/MMbtu) Decrease 1.00 (6.8)M (4.0)M…
Liquidity Position Capitalization ( in millions) 12/31/2011 3/31/2012 Cash 1 66 Long-Term Debt Revolving Credit Facility 332 250 Senior Notes Due 2016 255 255 Senior Notes Due 2018 600 600 Senior Notes Due 2021 500 500…
Sample Table and Footer Box Q&A NGL Logistics
Appendix
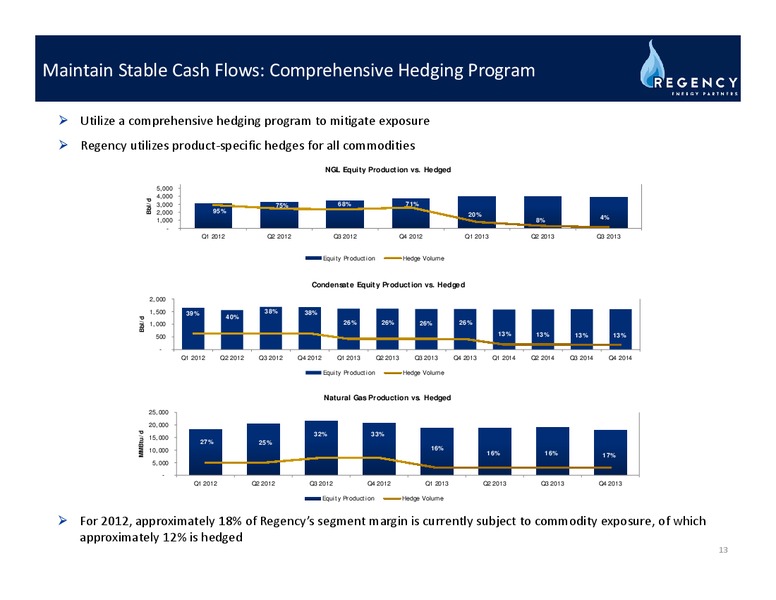
Maintain Stable Cash Flows: Comprehensive Hedging Program Utilize a comprehensive hedging program to mitigate exposure Regency utilizes productspecific hedges for all commodities NGL Equity Production vs. Hedged 5,000 4,000…
NonGAAP Reconciliation Three Months Ended March 31, 2012 December 31, 2011 September 30, 2011 June 30, 2011 March 31, 2011 ( in thousands) Net income 28,900 13,628 30,849 14,837 14,305 Add (deduct): Interest expense, net 29,557…
NonGAAP Reconciliation Three Months Ended December 31, 2010 September 30, 2010 June 30, 2010 March 31, 2010 Net (loss) income (8,923) 7,846 (9,391) (450) Add (deduct): Interest expense, net 19,791 20,393 22,223 20,564 Depreciation…
NonGAAP Reconciliation Three Months Ended March 31, 2012 December 31, 2011 September 30, 2011 June 30, 2011 March 31, 2011 ( in thousands) Net income 28,900 13,628 30,849 14,837 14,305 Add (Deduct): Operation and maintenance 40,981…
NonGAAP Reconciliation Three Months Ended December 31, 2010 September 30, 2010 June 30, 2010 March 31, 2010 ( in thousands) Net (loss) income (8,923) 7,846 (9,391) (450) Add (Deduct): Operation and maintenance 33,100 34,306 29,717…
NonGAAP Reconciliation Three Months Ended March 31, 2012 2011 ( in thousands) Net cash flows provided by operating activities 56,067 57,366 Add (deduct): Depreciation and amortization, including debt issuance cost, bond premium and…
 Loading...