Regency g y Energy gy Partners Fourth Quarter Earnings Release February 17, 2011
Forward-Looking Statements Certain matters discussed in this report include forward-looking statements. Forward-looking statements are identified as any statement that does not relate strictly to historical or current facts. Statements…
2010 Highlights Key Highlights Energy Transfer Equity acquired 100% of Regencys general partner Partnership I t d Introduced d new senior i lleadership d hi tteam with ith extensive t i experience i iin th the midstream id…
Fundamentals Review
Fundamentals: Drilling Activity Total U.S. land rig count increased 4% from Q3 2010 to Q4 2010 Largest increases occurred in the liquids-rich south Texas and Texas Gulf areas U.S. Drilling Rig Trends 400 Rig Count Trends - Regency…
Fundamentals: Commodity Prices February NYMEX contract settled at 4.32 per MMbtu1, which represents an 18% decrease year-over-year WTI crude has broken out of its 70-85/Bbl range and has reached the low 90s in recent weeks Gas…
2010 Performance Regency produced strong fourth-quarter and full-year 2010 financial results Comparing full-year 2010 to full-year 2009, adjusted EBITDA increased 55% year-over-year Pro Rata Adjusted EBITDA1 120 102 100 90…
Gathering and Processing Segment Margins continued to increase in the fourth quarter primarily due to increased Eagle Ford volumes in our south Texas region Gathering and Processing Throughput and Adjusted Segment Margin1,2 1,200…
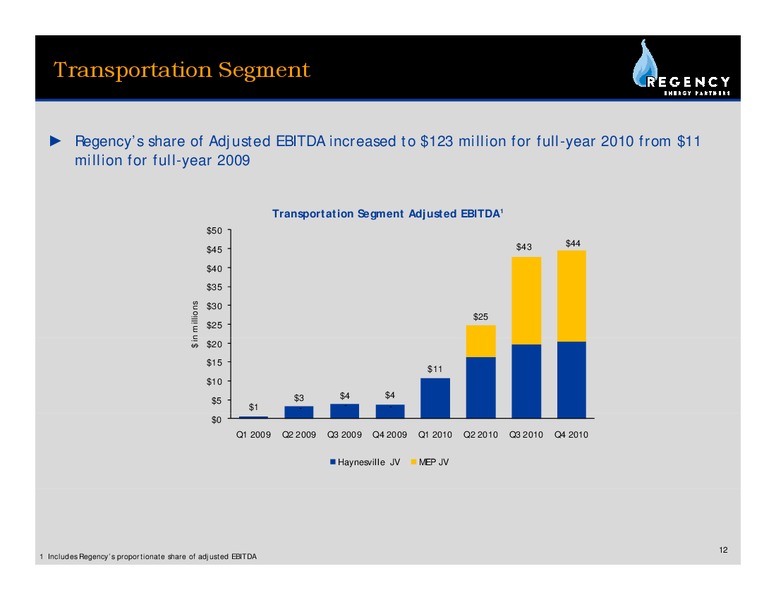
Transportation Segment Regencys share of Adjusted EBITDA increased to 123 million for full-year 2010 from 11 million for full-year 2009 Transportation Segment Adjusted EBITDA1 50 43 44 45 40 35 30 n millions 25 25…
Contract Compression & Contract Treating Segments Despite challenging market conditions, Regencys revenue generating horsepower has increased for five consecutive quarters and increased 12% from year end 2009 to year end 2010…
Financial Review
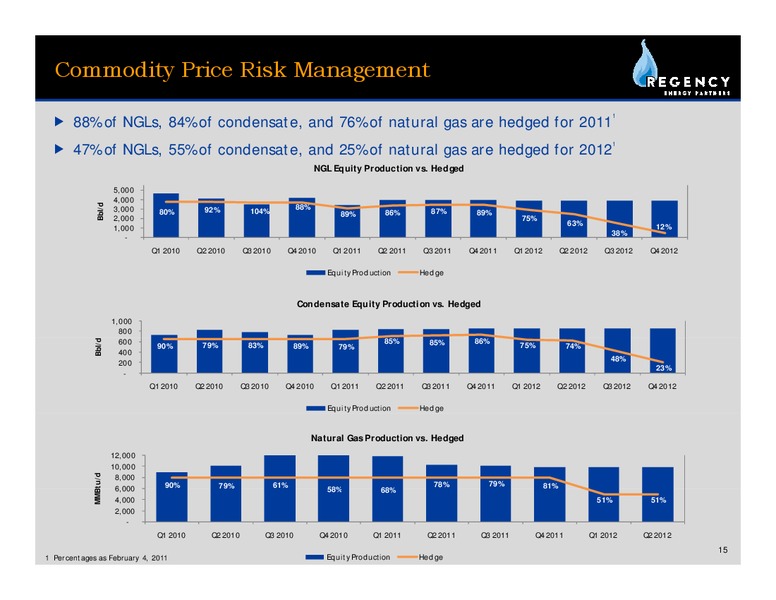
Commodity Price Risk Management 1 88% of NGLs, 84% of condensate, and 76% of natural gas are hedged for 2011 1 47% of NGLs, 55% of condensate, and 25% of natural gas are hedged for 2012 NGL Equity Production vs. Hedged 5,000…
Commodity Price Risk Management C3+ is hedged for 2012 at higher prices than 2011 (8-15%), while natural gas and ethane are both hedged at lower prices (6-8%) Executed Hedges by Product 2011 Q1 2012 Q2 2012 Q3 2012 Q4 2012 Price…
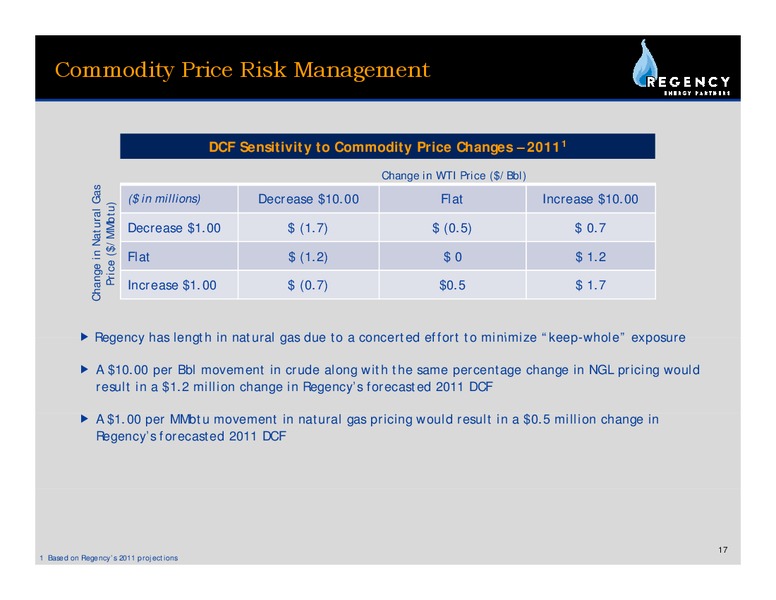
Commodity Price Risk Management DCF Sensitivity to Commodity Price Changes 20111 Change in WTI Price (/Bbl) Change in Natural Gass ( in millions) Decrease 10.00 Flat Increase 10.00 e (/MMbtu) Decrease 1.00 (1.7) (0.5)…
Strong Liquidity Position Raised approximately 408 million of equity in August 2010 Completed a 600 million debt restructuring/maturity extension in October 2010 Capitalization Regencys debt maturity profile has ( in millions)…
Q&A
Appendix
Consolidated Operating Results Regency Energy Partners LP Consolidated Statements of Operations ( in thousands) Year Ended December 31, 2010 December 31, 2009 (1) REVENUES Gas sales, including related party amounts 519,344…
Gathering and Processing Segment Three Months Ended December 31, 2010 September 30, 2010 June 30, 2010 March 31, 2010 ( in thousands) Gathering and Processing Segment Financial data: Segment margin (1) 52,915 42,723 49,568 50,802…
Contract Compression Segment Three Months Ended December 31, 2010 September 30, 2010 June 30, 2010 March 31, 2010 ( in thousands) Contract C t tC Compression i S Segmentt (1) Financial data: Segment margin 40,855 38,510 37,814…
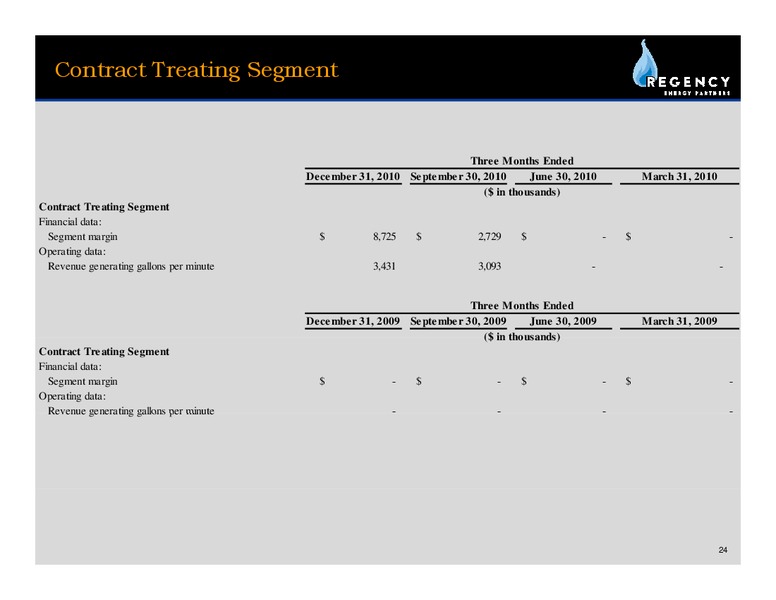
Contract Treating Segment Three Months Ended December 31, 2010 September 30, 2010 June 30, 2010 March 31, 2010 ( in thousands) Contract Treating Segment Financial data: Segment margin 8,725 2,729 - - Operating data: R Revenue…
Corporate and Others Segment Three Months Ended December 31, 2010 September 30, 2010 June 30, 2010 March 31, 2010 ( in thousands) Corporate & Others (1) Financial data: Segment margin 5 341 5,341 5 763 5,763 4 974 4,974 5 014…
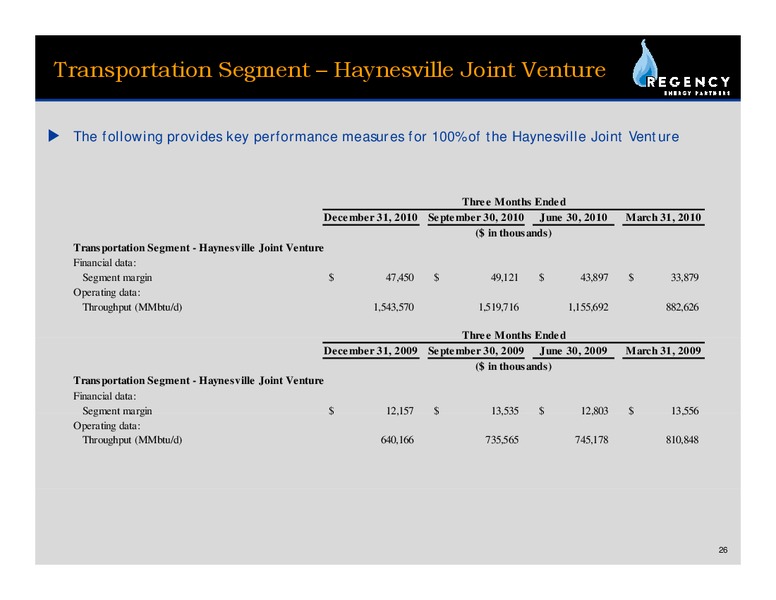
Transportation Segment Haynesville Joint Venture The following provides key performance measures for 100% of the Haynesville Joint Venture Three Months Ended December 31, 2010 September 30, 2010 June 30, 2010 March 31, 2010 ( in…
Transportation Segment MEP Joint Venture The following provides key performance measures for 100% of the MEP Joint Venture Three Months Ended December 31, 2010 September 30, 2010 June 30, 2010 March 31, 2010 ( iin thousands))…
Non-GAAP Reconciliation Year Ended December 31, 2010 2009 2008 ( in thousands) Net (loss) income (10,918) 140,489 101,328 Add (deduct): Interest expense, net 82,971 77,996 63,243 Depreciation and amortization 122,725 109,893…
Non-GAAP Reconciliation Year Ended December 31, 2010 2009 2008 ( in thousands) Net (loss) income (10,918) 140,489 101,328 Add (Deduct): Operation and maintenance 125,650 117,080 119,715 G Generall andd administrative d i i t ti…
Non-GAAP Reconciliation Three Months Ended December 31, 2010 ( in thousands) Net cash flows provided by operating activities 41,304 Add (deduct): Depreciation and amortization, including debt issuance cost amortization (34,556)…
 Loading...