g Regencyy Energy gy Partners First Quarter Earnings Release May 10, 2010
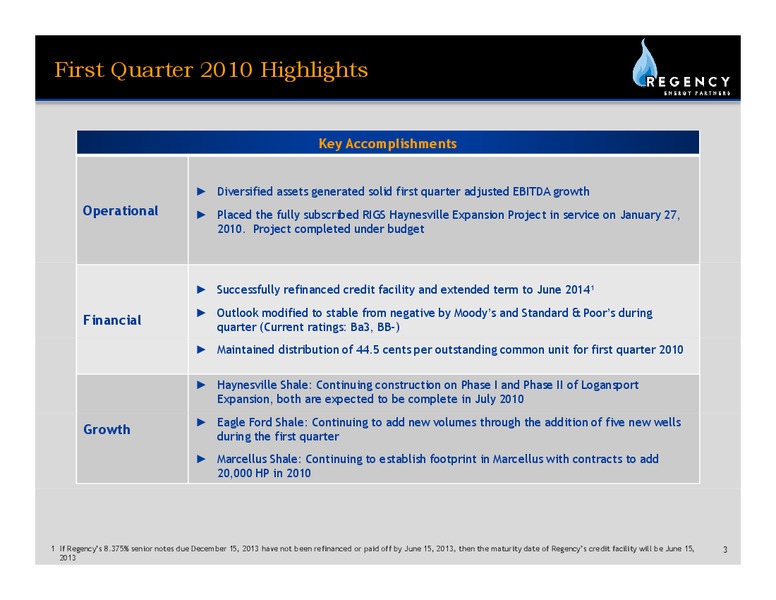
First Quarter 2010 Highlights Key Accomplishments Diversified assets generated solid first quarter adjusted EBITDA growth Operational Placed the fully subscribed RIGS Haynesville Expansion Project in service on January 27, 2010.…
Fundamentals Review
Fundamentals: Drilling Activity 19% increase in U.S. land rig counts from Q4 2009 to Q1 2010 High crude-gas ratio has increased the relative attractiveness of rich gas plays which have a higher oil component, including south Texas,…
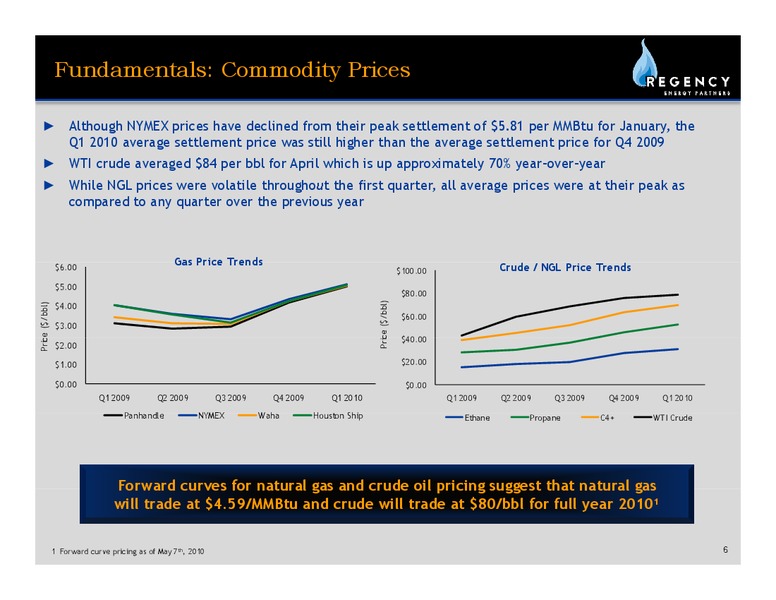
Fundamentals: Commodity Prices Although NYMEX prices have declined from their peak settlement of 5.81 per MMBtu for January, the Q1 2010 average settlement price was still higher than the average settlement price for Q4 2009 WTI…
Haynesville Joint Venture Buyback y
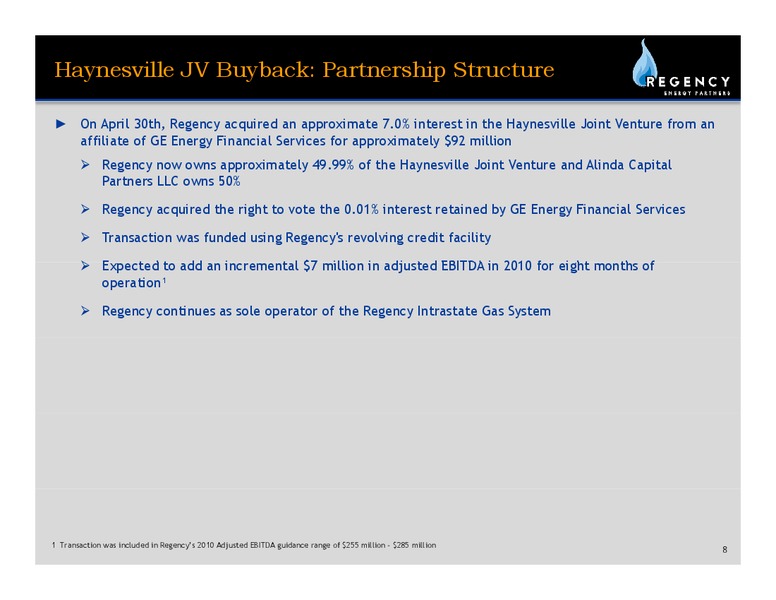
Haynesville JV Buyback: Partnership Structure On April 30th, Regency acquired an approximate 7.0% interest in the Haynesville Joint Venture from an affiliate of GE Energy Financial Services for approximately 92 million Regency now…
Haynesville Shale: Regency Presence Regencys increased stake in the Haynesville Joint Venture is consistent with our long- term growth strategy of increasing fee-based assets, which generate stable cash flows Haynesville…
Business Review
First Quarter 2010 Performance f Regencys Q1 2010 financial performance was in line with managements expectations Comparing Q1 2010 to Q1 2009, adjusted EBITDA increased 11% year-over-year Combined adjusted total segment margin…
Transportation Segment Year-over-year, combined Transportation segment margin increased by almost 150% from 14 million in Q1 2009 to 34 million in Q1 2010 First quarter results included two months of volumes for the Haynesville…
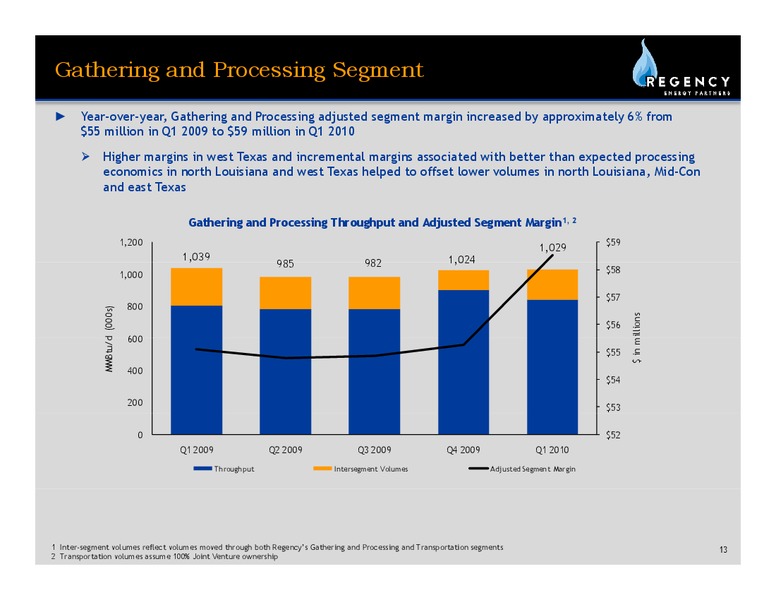
Gathering and Processing Segment Year-over-year, Gathering and Processing adjusted segment margin increased by approximately 6% from 55 million in Q1 2009 to 59 million in Q1 2010 Higher margins in west Texas and incremental margins…
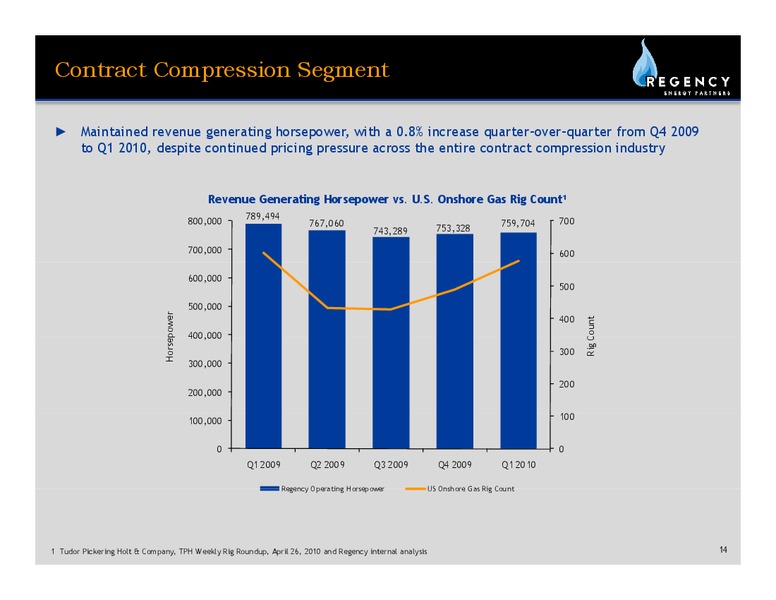
Contract Compression Segment Maintained revenue generating horsepower, with a 0.8% increase quarter-over-quarter from Q4 2009 to Q1 2010, despite continued pricing pressure across the entire contract compression industry Revenue…
Financial Review
Consolidated Operating Results (Year-Over-Year) Regency Energy Partners LP Consolidated Income Statements ( in thousands) Three Months Ended March 31, 2010 March 31, 2009 REVENUES Gas sales 142,893 148,270 NGL sales 97,329…
Commodity Price Risk Management f 73% of NGLs, 84% of condensate and 74% of natural gas are hedged for the balance of 2010 f 41% of NGLs, 50% of condensate and 23% of natural gas are hedged for 2011 NGL Equity Production vs. Hedged 5…
Commodity Price Risk Management f Consistent with our quarterly hedging program, we plan to begin layering in our 2012 hedges during the second quarter of 2010 E Executed t dHHedges d by b Product P d t 2010 2011 Bbl/d Price…
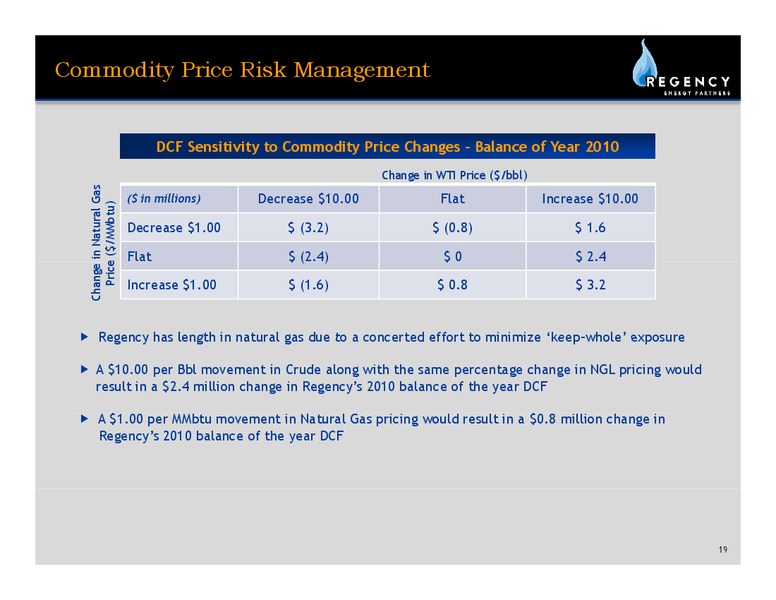
Commodity Price Risk Management DCF Sensitivity to Commodity Price Changes Balance of Year 2010 Change in WTI Price (/bbl) Change in Natural Gass ( in millions) Decrease 10.00 Flat Increase 10.00 e (/MMbtu) Decrease 1.00…
Liquidity Update f During the first quarter of 2010, successfully refinanced our credit facility Extended maturity from August 2011 to June 2014 Maintained size of facility at 900 million while reducing number of lenders from 26 to…
Q&A
Appendix
Gathering and Processing Segment (Year-Over-Year) Three Months Ended March 31, 2010 2009 ( in thousands) Gathering and Processing Segment Financial data (1): Segment margin 54,708 58,675 Adjusted segment margin 58,514 55,110…
Combined Transportation Segment (Year-Over-Year) Three Months Ended March 31, 2010 2009 ( in thousands) Transportation Segment Financial data: Segment margin - 11,554 Operating data: Throughput (MMbtu/d) - 812,332 Three…
Contract Compression Segment (Year-Over-Year) Three Months Ended March 31, 2010 2009 ( in thousands) Contract Compression Segment Financial data: Segment margin 37,030 36,981 Operating data: Revenue generating horsepower 759,704…
Corporate and Others Segment (Year-Over-Year) Three Months Ended March 31, 2010 2009 ( in thousands) Corporate & Others Financial data: Segment margin (1) 6,737 824 (1) Segment S margin i varies i from f previously i l…
Non-GAAP Reconciliation (Year-Over-Year) Three Months Ended March 31, 2010 2009 2008 ( in thousands) Net (loss) income (450) 148,424 10,420 Add (deduct): Interest expense, p , net 22,345 , 14,227 , 15,406 , Depreciation and…
Non-GAAP Reconciliation (Year-Over-Year)1 Three Months Ended March 31, 2010 2009 2008 ( in thousands) Adjusted Total Segment Margin 96,949 103,659 94,736 Adjusted Total Segment Margin for Haynesville Joint Venture (a) 33,879 2,002…
Non-GAAP Reconciliation (Year-Over-Year) Three Months Ended March 31, 2010 2009 2008 ( in thousands) Net (loss) income (450) 148,424 10,420 Add (Deduct): Operation and maintenance 32,411 32 411 36,042 36 042 28,845 28 845…
Non-GAAP Reconciliation Three Months Ended March 31, 2010 ( in thousands) Net cash flows provided by operating activities 32,781 Add (deduct): Other assets and liabilities 35 Distribution received from unconsolidated subsidiary…
 Loading...