Regency Energy Partners SecondQuarter Earnings Release August 8, 2012
SecondQuarter Performance Comparing the second quarter of 2012 to the second quarter of 2011, adjusted EBITDA increased approximately 12% Adjusted EBITDA1 160 140 134 120 112 115 115 103 100 in millions 80 60…
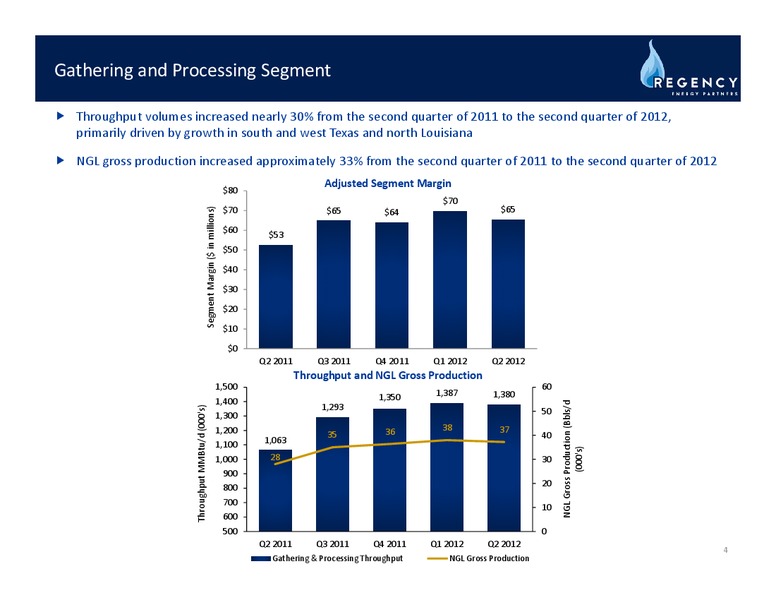
Gathering and Processing Segment Throughput volumes increased nearly 30% from the second quarter of 2011 to the second quarter of 2012, primarily driven by growth in south and west Texas and north Louisiana NGL gross production…
Joint Ventures Segment Adjusted EBITDA for the Joint Ventures segment increased from the second quarter of 2011 to the second quarter of 2012 Joint Ventures Segment Adjusted EBITDA1 70 58 57 59 60 55 56 50 in…
Contract Compression Segment Increased producer activity in liquidsrich plays is overcoming horsepower declines in drygas regions 45 Segment Margin Segment Margin ( in millions) 40 3 4 4 4 35 3 30 25 20 34 35 35 35 34 15…
Contract Treating Segment Focusing on accommodating shift to liquidsrich regions Contract Treating Revenue Generating GPM 4,000 20 3,773 3,800 18 Segment Margin ( in millions) 3,600 3,468 3,465 16 Revenue Generating…
Maintain Stable Cash Flows: Business Mix Focus on maintaining over 80% feebased margins Adjusted Total Segment Margin FY 2009 FY 2010 FY 2011 FY 2012E 6% 9% 3% 11% 9% 2% 21% 27% 71% 76% 83% 82% Feebased Hedged…
Liquidity Position Capitalization ( in millions) 12/31/2011 6/30/2012 Cash 1 16 LongTerm Debt Revolving Credit Facility 332 515 Senior Notes Due 2016 255 166 Senior Notes Due 2018 600 600 Senior Notes Due 2021 500 500…
Sample Table and Footer Box Q&A NGL Logistics
Appendix
Maintain Stable Cash Flows: DCF Sensitivities DCF Sensitivity to Commodity Price Changes 2012 Change in WTI Price (/Bbl) Change in Natural Gas Price Decrease 10.00 Flat Increase 10.00 (/MMbtu) Decrease 1.00 (3.8)M…
Maintain Stable Cash Flows: Comprehensive Hedging Program Utilize a comprehensive hedging program to mitigate exposure C2 to C4 Equity Production vs. Hedged 5,000 4,000 Bbl/d 3,000 64% 65% 2,000 84% 81% 17% 4% 1,000 7% Q1…
NonGAAP Reconciliation Three Months Ended June 30, 2012 March 31, 2012 December 31, 2011 September 30, 2011 June 30, 2011 ( in thousands) Net income 29,327 28,900 13,628 30,849 14,837 Add (deduct): Interest expense, net 27,934…
NonGAAP Reconciliation Three Months Ended June 30, 2012 March 31, 2012 December 31, 2011 September 30, 2011 June 30, 2011 ( in thousands) Net income 29,327 28,900 13,628 30,849 14,837 Add (deduct): Operation and maintenance 38,992…
NonGAAP Reconciliation Three Months Ended June 30, 2012 2011 ( in thousands) Net cash flows provided by operating activities 46,129 72,136 Add (deduct): Depreciation and amortization, including debt issuance cost and bond premium…
 Loading...