Regency Energy Partners Third Quarter Earnings Release November 9, 2010
Forward-Looking Statements Certain matters discussed in this report include forward-looking statements. Forward-looking statements are identified as any statement that does not relate strictly to historical or current facts. Statements…
Recent Highlights Key Accomplishments Completed 193-million1 Zephyr acquisition, expanding our treating capabilities in the contract services segment Growth / Achieved continued adjusted EBITDA growth, including a full-quarter…
Fundamentals Review
Fundamentals: Drilling Activity 10% increase in U.S. land rig counts from Q2 2010 to Q3 2010 Rich gas plays continue to be attractive targets for producers as a result of the high crude-to-gas ratio U.S. Drilling Rig Trends 350…
Fundamentals: Commodity Prices October NYMEX contract settled at 3.84 per MMbtu1, which represents a 2.9% increase year-over-year WTI prices have traded primarily between 70 and 85 per Bbl year-to-date Currently, prices are testing…
Business Review
Third Quarter 2010 Performance Regency produced strong third quarter 100 Adjusted EBITDA1 90 financial results 90 80 Comparing Q3 2010 to Q3 2009, adjusted EBITDA 70 increased 77% year-over-year 60 51 50 40 30 20 10 0 Q3…
Gathering and Processing Segment Margins were higher in the third quarter primarily due to increased Eagle Ford volumes in our south Texas region Low margin volumes were down at our Elm Grove & Dubberly refrigeration plants in…
Transportation Segment Increased adjusted EBITDA due primarily to a full-quarter contribution from the MEP Joint Venture Transportation Segment Adjusted EBITDA1 45 43 40 35 30 25 in millions 25 20 11 15 10 - 3 4 4 5…
Contract Services Segment Regencys revenue generating horsepower increased by 4.2% quarter-over-quarter This is the second consecutive quarter of approximately 4% growth Revenue Generating Horsepower 900,000 823,369 790,294…
Continued Fee-Based Growth Regency has continued to improve its fee-based margin mix in 2010 Full-year 2010 gross margin forecast is now 76% fee-based Regency estimates fee-based gross margin to contribute over 80% for 2011 FY…
Financial Review
Consolidated Operating Results (Year-Over-Year) Regency Energy Partners LP Consolidated Statements of Operations ( in thousands) Three Months Ended September 30, 2010 September 30, 2009 (1) REVENUES Gas sales, including…
Commodity Price Risk Management 1 75% of NGLs, 64% of condensate, and 49% of natural gas are hedged for 2011 1 20% of NGLs and 17% of condensate are hedged for 2012 NGL Equity Production vs. Hedged 5,000 4,000 70% 77% 75% 68%…
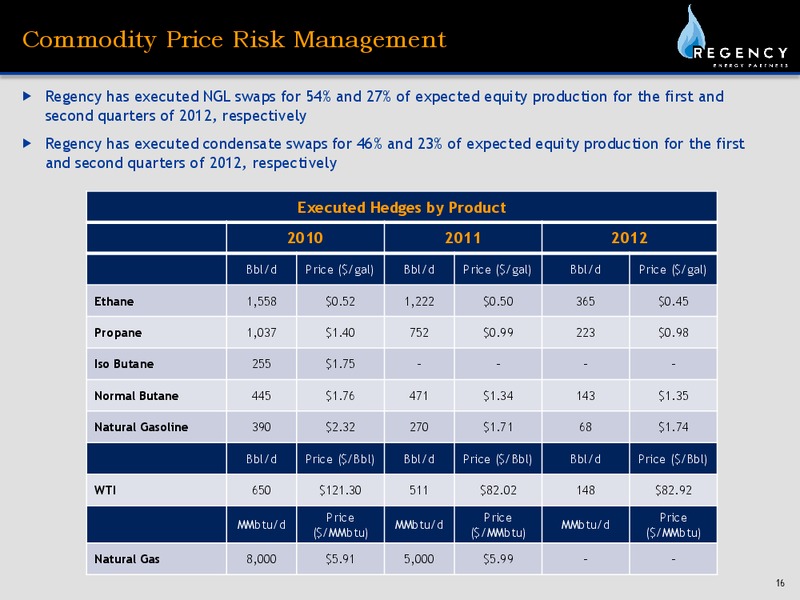
Commodity Price Risk Management Regency has executed NGL swaps for 54% and 27% of expected equity production for the first and second quarters of 2012, respectively Regency has executed condensate swaps for 46% and 23% of expected…
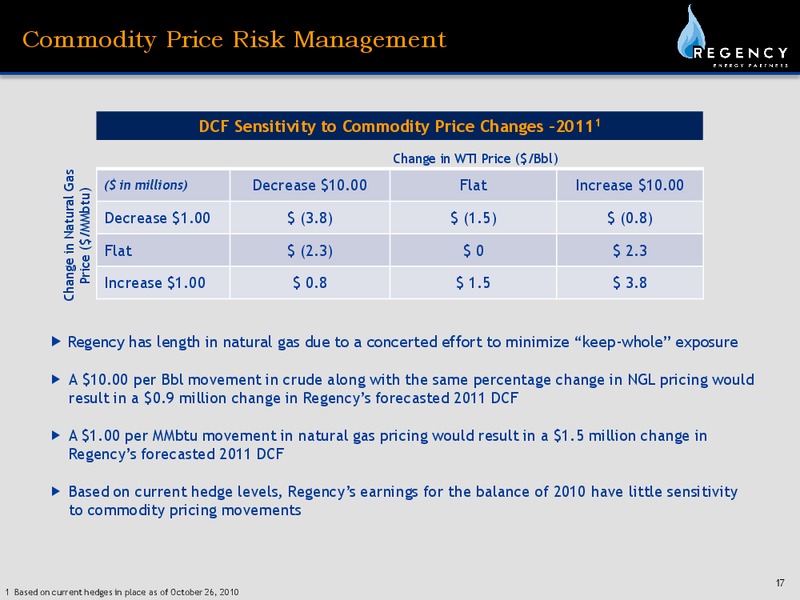
Commodity Price Risk Management DCF Sensitivity to Commodity Price Changes 20111 Change in WTI Price (/Bbl) Change in Natural Gas ( in millions) Decrease 10.00 Flat Increase 10.00 Price (/MMbtu) Decrease 1.00 (3.8) (1.5)…
2010 Organic Growth Capital Forecast Regency increased its 2010 organic growth capital expenditure forecast to 259 million Increase due to 14 million of additional capital for the Contract Services segment 2010 Organic Growth…
Strong Liquidity Position Recently completed a 400 million1 equity offering in August 2010 and a 600 million debt restructuring/maturity extension in October 2010 Capitalization Revolving Credit Facility Pro Forma for 600-million…
Q&A
Appendix
Gathering and Processing Segment (Year-Over-Year) Three Months Ended September 30, 2010 2009 ( in thousands) Gathering and Processing Segment Financial data: Segment margin (1) 42,723 54,718 Adjusted segment margin (1) 56,690…
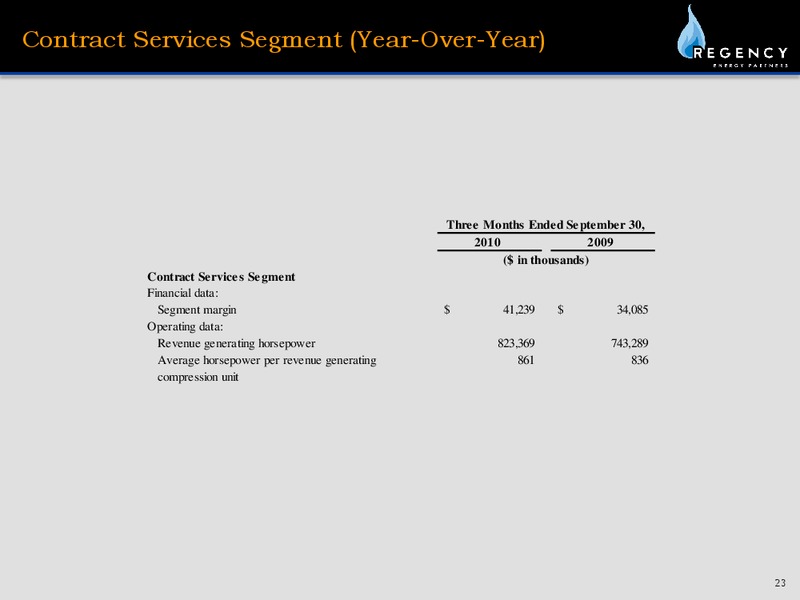
Contract Services Segment (Year-Over-Year) Three Months Ended September 30, 2010 2009 ( in thousands) Contract Services Segment Financial data: Segment margin 41,239 34,085 Operating data: Revenue generating horsepower 823,369…
Corporate and Others Segment (Year-Over-Year) Three Months Ended September 30, 2010 2009 ( in thousands) Corporate & Others Financial data: Segment margin (1) 5,763 1,901 (1) Segment margin varies from previously disclosed…
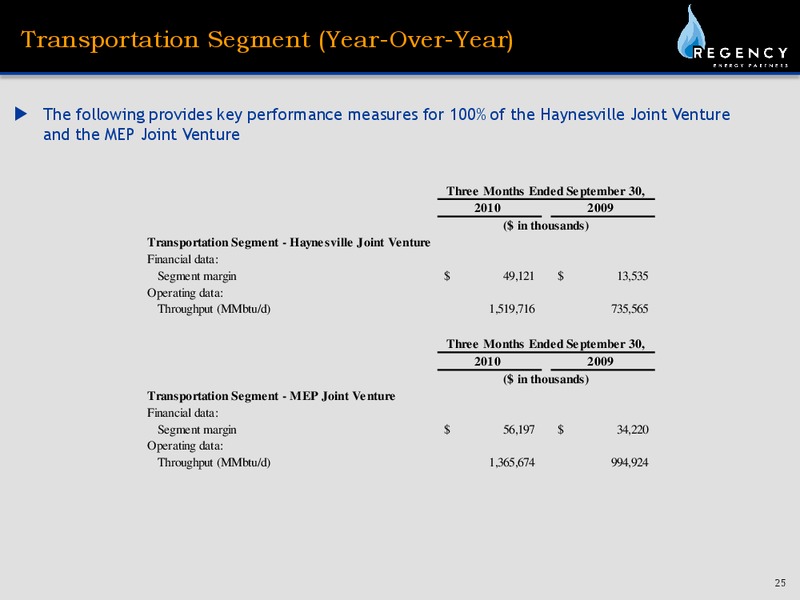
Transportation Segment (Year-Over-Year) The following provides key performance measures for 100% of the Haynesville Joint Venture and the MEP Joint Venture Three Months Ended September 30, 2010 2009 ( in thousands)…
Non-GAAP Reconciliation (Year-Over-Year) Three Months Ended September 30, 2010 2009 2008 ( in thousands) Net income (loss) 7,846 (10,543) 49,069 Add (deduct): Interest expense, net 20,393 22,173 16,073 Depreciation and amortization…
Non-GAAP Reconciliation (Year-Over-Year) Three Months Ended September 30, 2010 2009 2008 ( in thousands) Net income (loss) 7,846 (10,543) 49,069 Add (Deduct): Operation and maintenance 34,306 28,720 29,904 General and…
Non-GAAP Reconciliation Three Months Ended September 30, 2010 ( in thousands) Net cash flows provided by operating activities 54,689 Add (deduct): Depreciation and amortization, including debt issuance cost amortization (33,437)…
Non-GAAP Reconciliation (2010 Guidance) Low Estimate High Estimate ( in thousands) Forecasted net income 65,000 85,000 Add: Depreciation and amortization 120,000 120,000 Interest Expense 75,000 80,000 EBITDA at JV in excess of…
 Loading...