Agenda Introduction Samir Brikho, Chief Executive Financial performance Ian McHoul, Chief Financial Officer Focus on delivery and growth Samir Brikho 2
Delivering Vision 2015 target ahead of schedule EPS100p before 2015 Context Strategy Priorities Market environment Vision 2015 Delivery and growth Growing demand for Customers Integrated services energy and resources People…
2011: delivering our strategy Strong operating performance Revenue 3,261 million, up 11 per cent Diluted EPS 70.5 pence, up 13 per cent Operating cash flow, up 22 per cent Good order intake and forward visibility Acquisitions…
AMEC plc Full-year results 2011 Ian McHoul, Chief Financial Officer
Changes to reporting allocations in 2011 From 2011 the allocation of certain items has been changed UK Asset Support business (2010 EBITA c. 7 million) transferred from Power & Process to Natural Resources Certain financing items…
Highlights million 2011 2010 Revenue 3,261 2,951 +11% EBITA* 299 269 +12% EBITA margin 9.2% 9.1% +10bps Operating cash flow** 267 219 +22% Profit before tax* 311 280 +11% Earnings per share*** 70.5p 62.5p +13% Dividend per share…
Natural Resources million 2011 2010 Revenue 1,742 1,603 +9% EBITA 192 179 +7% EBITA margin 11.0% 11.1% -10bps Average employees* 12,239 10,704 +14% Order book 2.19bn 1.87bn +17% Strong second half * Full time…
Natural Resources Revenue growth (%) EBITA development (m) 4% Pace of revenue growth to accelerate * Year-on-year impact of material acquisitions ** Year-on-year impact of currency translation from US and Cdn into 9
Power & Process million 2011 2010 Revenue 849 802 +6% EBITA 72 65 +11% EBITA margin 8.5% 8.1% +40bps Average employees* 7,042 6,536 +8% Order book 1.04bn 0.99bn +5% Strategic refocusing continues * Full time…
Power & Process Revenue growth (%) EBITA development (m) 6% 6% Focus on business mix and margin * Year-on-year impact of material acquisitions ** Year-on-year impact of currency translation from US and Cdn into 11 11
Environment & Infrastructure million 2011 2010 Revenue 722 593 +22% EBITA 66 55 +21% EBITA margin 9.2% 9.2% in line Average employees* 6,262 4,517 +39% Order book 0.48bn 0.27bn +78% Improving competitive position through…
Environment & Infrastructure Revenue growth (%) EBITA development (m) 26% -2% -2% 22% Well placed for further expansion * Year-on-year impact of material acquisitions ** Year-on-year impact of currency translation from US…
Tax 2011 2010 Underlying rate1 c.29% c.30% P&L charge2 24.1% 25.9% Cash paid 36m 38m Underlying rate falling Canadian and UK corporate tax rates reducing Charge reducing Active management Sustainable rate in the mid-20s…
Operating cash flow million 2011 2010*** EBITA 299 269 JV EBITA (26) (24) 273 245 JV dividends received 17 17 Non-cash items* 21 25 311 287 Working capital (44) (68) Operating cash flow** 267 219 Cash conversion 89% 81%…
Operating cash flow conversion million Aggregate cash conversion over last 5 years 90% * Before amortisation and exceptional items ** Before capital transactions and shareholder returns 16 16
Cash flow million 2011 2010 Operating cash flow 267 219 Acquisitions and disposals* (297) (111) Interest and tax (30) (32) Dividends and share acquisitions (98) (69) Net investment hedges** (20) - Other*** (41) (30) Net cash…
Pension schemes Funding* million Dec 2011 Dec 2011 Dec 2010 Gross assets Surplus / (deficit) Surplus/ (deficit) UK schemes 1,469 32 63 Other schemes 100 (81) (36) 1,569 (49) 27 Net interest Est 2012 2011 2010 million 10 9…
Balance sheet and cash Strong balance sheet Cash at 31 December 2011 of 521 million Pipeline for acquisitions remains strong Moving to a more efficient capital structure Return of capital On market share buyback programme of 400…
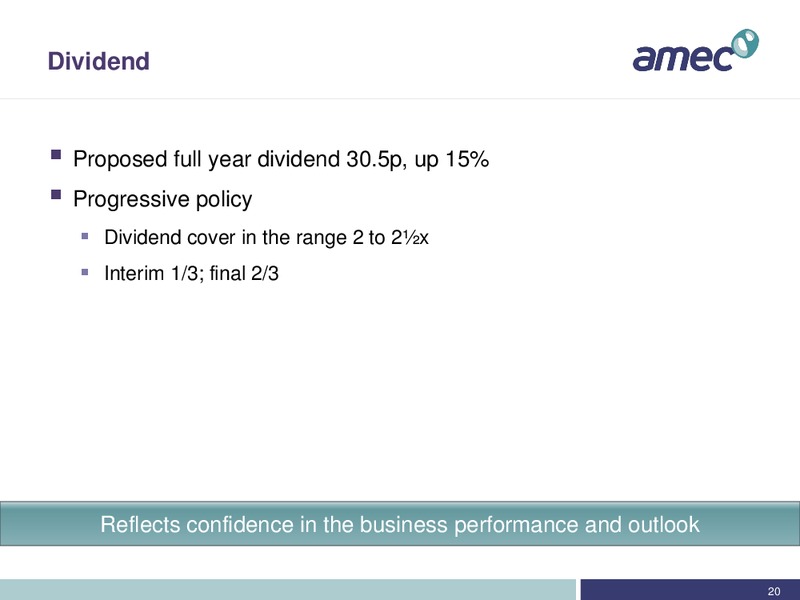
Dividend Proposed full year dividend 30.5p, up 15% Progressive policy Dividend cover in the range 2 to 2x Interim 1/3; final 2/3 Reflects confidence in the business performance and outlook 20 20
Outlook Revenue growth Double digit underlying growth Boosted by 2011 acquisitions Margin reduction Business mix and increased procurement Financial strength Acquisitions pipeline strong Share buyback programme Well…
Delivering Vision 2015 target ahead of schedule EPS100p before 2015 Context Strategy Priorities Market environment Vision 2015 Delivery and growth Growing demand for Customers Integrated services energy and resources People…
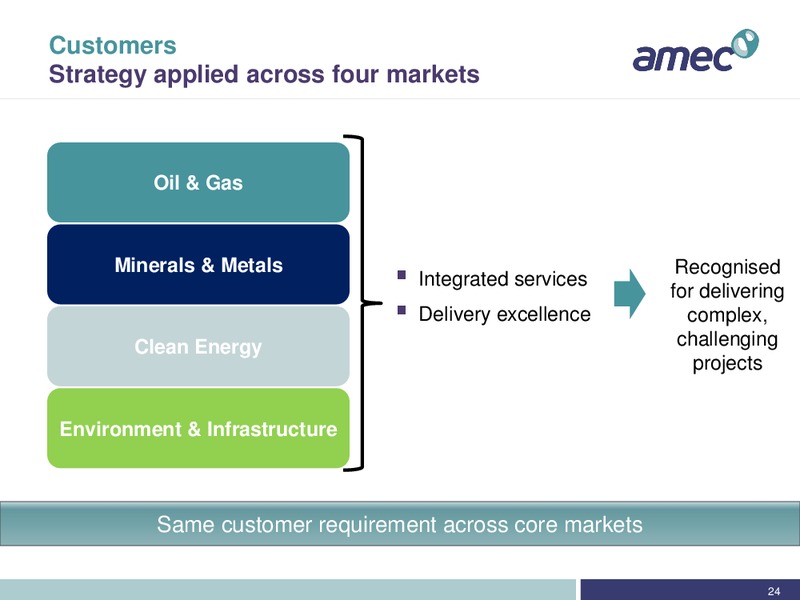
Customers Strategy applied across four markets Oil & Gas Minerals & Metals Recognised Integrated services for delivering Delivery excellence complex, Clean Energy challenging projects Environment & Infrastructure Same…
Customers Suite of integrated services Kearl project, Various projects, Sellafield Ltd, NDA Imperial Oil Newmont Mining Corp Leveraging One AMEC Multi-disciplinary approach Programme management expertise AMEC services: KIP…
Customers Common approach drives excellent delivery GoCell project, Western Range project, GDF SUEZ Sappi ArcelorMittal Collaborative approach Serving multiple markets Expanding into new markets Project located at Sappis…
Customers Recognised for technical expertise MWCS, Marine Well Oyu Tolgoi, Clair Ridge project, BP Containment Company Rio Tinto/Ivanhoe Mines Complex engineering challenge Industry critical project Underground mining Largest…
People Attract, develop, retain Successfully recruited in constrained market Group headcount up 17% Supported by longer term skills strategy (graduates, trainees, universities and schools) Record number of graduates over 250…
Growth Acquisitions integration Minerals & Metals Minerals & Metals: current project portfolio Minerals & Metals centres of excellence Project lead team Americas E&I Australia Donlin gold Saskatchewan Kosmurun potash…
Summary Strategy is delivering results Strong customer relationships Recognised for delivering complex, challenging projects Expect to deliver Vision 2015 target ahead of schedule Priority for 2012 Integrated services Delivery…
AMEC plc Full-year results 2011 Q&A
AMEC plc Preliminary results 2011 Supplementary information
Revenue by markets and geography Revenue by market Revenue by geography Environment & Infrastructure Government services: 6% Industrial/Commercial: 4% Transport/Infrastructure: 3% Water/Municipal: 3% Oil & Gas Clean Energy Oil &…
Health and safety 2011 Key Performance Indicators (KPIs) We track a number of metrics to help us understand our progress towards Vision 2015, including: Lost time incident frequency rate Total recordable case frequency rate Per…
versus North American currencies 2011 2010 % Income statement Cdn 1.59 1.60 -1% US 1.60 1.54 +4% Balance sheet Cdn 1.58 1.56 +1% US 1.55 1.57 -1% 35 35
Profit reconciliation Per consol income Joint(ii ) Per million ventures presentation statement Natural Resources 192 Power & Process 72 Environment & Infrastructure 66 Investments & other 3 Corporate costs (34) Profit before…
Order book billion Dec 11 Dec 10 Natural Resources 2.19 1.87 Power & Process 1.04 0.99 Environment & Infrastructure 0.48 0.27 3.71 3.13 37 37
Amortisation and exceptional items million 2011 2010 Continuing operations Amortisation (i) (39) (25) Disposals & closures (ii) 2 19 Other (iii) (8) (8) (45) (14) Tax 17 43 (28) 29 Discontinued operations 25 (2) (3) 27 (i)…
Tax rate* Group companies JVs Total million EBITA per presentation 273 26 299 Net financing income 16 (4) 12 289 22 311 Tax (69) (7) (76) PAT per consolidated 220 15 235 Tax rate 23.7% 30.4% 24.1% * Before amortisation…
Changes to reporting allocations From 2011 the allocation of certain items on the income statement has been changed UK Asset Support business has transferred from Power & Process to Natural Resources and is reported accordingly…
Changes to reporting allocations Impact on 2010 As reported As restated million Revenue EBITA EBITA % Revenue EBITA EBITA % Natural Resources 1,520.5 174.7 11.5% 1,602.8 178.6 11.1% Power & Process 884.4 75.3 8.5% 802.1 64.8 8.1%…
 Loading...