Good progress in first half of 2011 First-half results in line with expectations Revenue up 4%; EBITA up 9%; margins at 8.2% EPS up 13% at 28.8 pence Average headcount up 12% Invested c. 260 million in 4 targeted acquisitions…
AMEC plc Interim results 2011 Ian McHoul, Chief Financial Officer
Changes to reporting allocations in 2011 From 2011 the allocation of certain items has been changed UK Asset Support business (2010 EBITA c. 7m) transferred from Power & Process to Natural Resources Certain financing items…
Highlights million 6 months ending 30 June 2011 2010 Revenue 1,484 1,430 +4% EBITA* 122 112 +9% EBITA margin 8.2% 7.8% +40bps Operating cash flow** 75 57 +32% Profit before tax* 126 116 +9% Earnings per share*** 28.8p 25.5p +13%…
Natural Resources million 2011 2010 6 months ending 30 June Revenue 790 783 +1% EBITA 84 84 in line EBITA margin 10.6% 10.7% -10 bps Average employees* 11,657 10,737 +9% Order book 2.07bn 1.85bn +12% Revenue stable…
Natural Resources Revenue growth (%) EBITA development (m) +2% -1% -1 +2 +1% -1 Stronger growth expected in H2 * Year-on-year impact of material acquisitions and disposals ** Year-on-year impact of currency translation 10
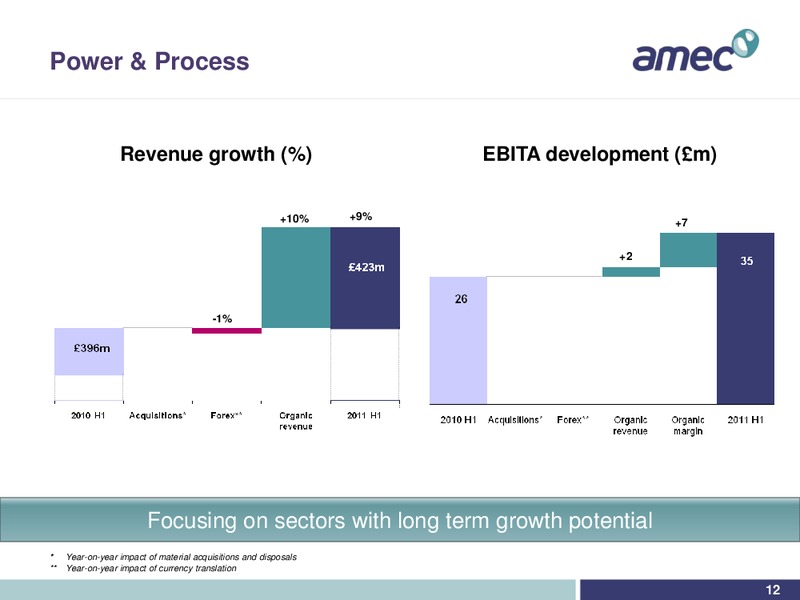
Power & Process million 6 months ending 30 June 2011 2010 Revenue 432 396 +9% EBITA 35 26 +37% EBITA margin 8.1% 6.5% +160bps Average employees* 6,946 6,291 +10% Order book 0.82bn 1.32bn -38% Strategic refocusing continues…
Power & Process Revenue growth (%) EBITA development (m) +10% +9% +7 +2 -1% Focusing on sectors with long term growth potential * Year-on-year impact of material acquisitions and disposals ** Year-on-year impact of…
Environment & Infrastructure million 6 months ending 30 June 2011 2010 Revenue 289 275 +5% EBITA 24 21 +12% EBITA margin 8.3% 7.8% +50bps Average employees* 5,213 4,244 +23% Order book 0.49bn 0.31bn +58% Continued…
Environment & Infrastructure Revenue growth (%) EBITA development (m) +7% -3% +4 -1 +1% +5% MACTEC acquisition to drive growth * Year-on-year impact of material acquisitions and disposals ** Year-on-year impact of currency…
Tax 2011 FY 2010 FY 2009 FY Estimate Actual Actual Approximate underlying rate1 29% 30% 32% P&L charge2 c.24% 25.9% 27.0%3 Cash paid (m) c.50 38 71 Underlying rate falling Canadian and UK corporate tax rates reducing Charge…
Operating cash flow million 6 months ending 30 June 2011 2010*** EBITA 122 112 JV EBITA (13) (13) Statutory PBIT 109 99 JV dividend received 4 6 Non-cash items* 10 14 123 119 Working capital (48) (62) Operating cash flow** 75 57…
Cash conversion million Half year comparables Targeting average operating cash conversion of 90% * Before amortisation and exceptional items ** Before capital transactions and shareholder returns 17
Cash flow million 6 months ending 30 June 2011 2010 Operating cash flow 75 57 Acquisitions and disposals* (276) (85) Interest and tax (19) (20) Dividends and share acquisitions (35) (32) Other** (25) (13) Net cash flow (280) (93)…
Dividend Interim dividend in 2011 10.2p, up 40% Represents underlying increase of 15% Dividend rebased in 2010, up 50% Interim 7.3p +20% Final 19.2p +66% 26.5p +50% Progressive policy Dividend cover in the range 2 to 2x Interim…
Capital structure Strong balance sheet Cash at 30 June 2011 455 million Intention to move to a more efficient capital structure Preference to use balance sheet to grow the business Will consider additional distributions…
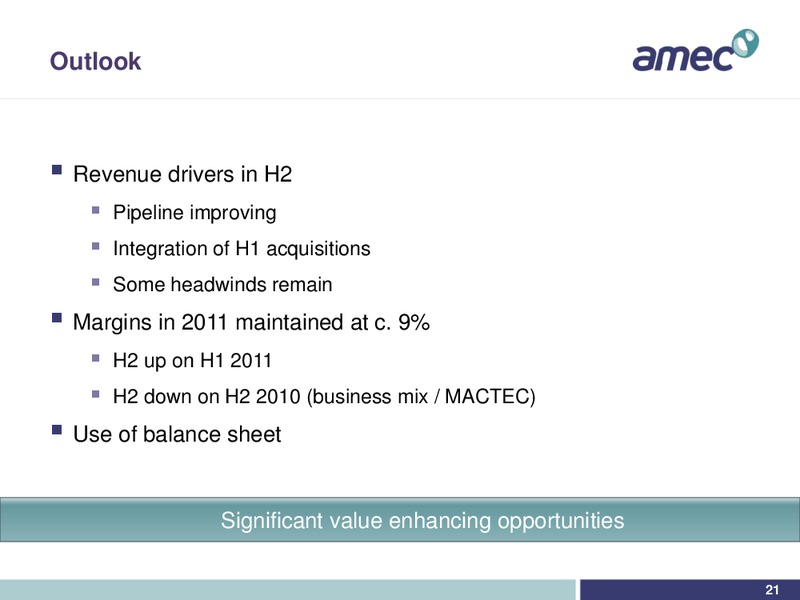
Outlook Revenue drivers in H2 Pipeline improving Integration of H1 acquisitions Some headwinds remain Margins in 2011 maintained at c. 9% H2 up on H1 2011 H2 down on H2 2010 (business mix / MACTEC) Use of balance sheet…
Vision 2015 priorities H1 progress Strategic priorities Good progress YTD Customers a Expanded relationships: BG, BP, Magnox Expand position with existing customers New include: Paladin, Bannerman, Urenco, MWCC, QGS, Eastern Star…
Delivering Vision 2015 Growth by strengthened market position Oil & Gas Clean Energy North Sea activity up Winning new clients Renewed activity in Gulf of Mexico MWCC 2 acquisitions added 500 people 3 nuclear contracts announced…
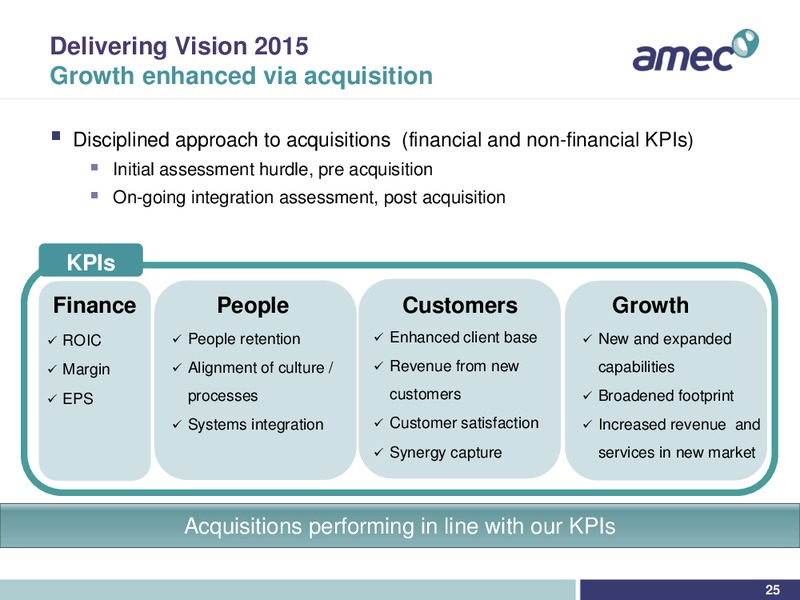
Delivering Vision 2015 Growth enhanced via acquisition Disciplined approach to acquisitions (financial and non-financial KPIs) Initial assessment hurdle, pre acquisition On-going integration assessment, post acquisition KPIs…
Delivering Vision 2015 People and our platform for growth People Sustainability HSSE** 20,000 people have benefitted 2011 FY carbon footprint Total Recordable Case from AMEC Academy forecast to reduce 15% on 2010 Frequency Rate at…
Delivering Vision 2015 Strong customer relationships AMEC has a strong team and access to high-quality engineering, project and construction management resources, which is key to the team's project delivery objectives. We look forward…
Summary Customers, people, growth Continued growth expected Great customer relationships Platform for continued growth people Demand for services and investment in end markets remains strong Equipped to deal with economic…
AMEC plc Interim results 2011 Questions
v North American currencies 2011 2010 H1 H1 % Income statement Cdn 1.58 1.59 -1% US 1.63 1.52 +7% Balance sheet Cdn 1.55 1.59 -3% US 1.61 1.49 +8% 31
Profit reconciliation Per consol million income Joint(ii) Per 6 months ending 30 June 2011 statement ventures presentation Natural Resources 84 Power & Process 35 Environment & Infrastructure 24 Investments & Other (4) Corporate…
Order book billion Jun 11 Dec 10* Jun 10* As at: Natural Resources 2.07 1.87 1.85 Power & Process 0.82 0.99 1.32 Environment & Infrastructure 0.49 0.27 0.31 3.38 3.13 3.48 * Restated for the transfer of the UK asset support…
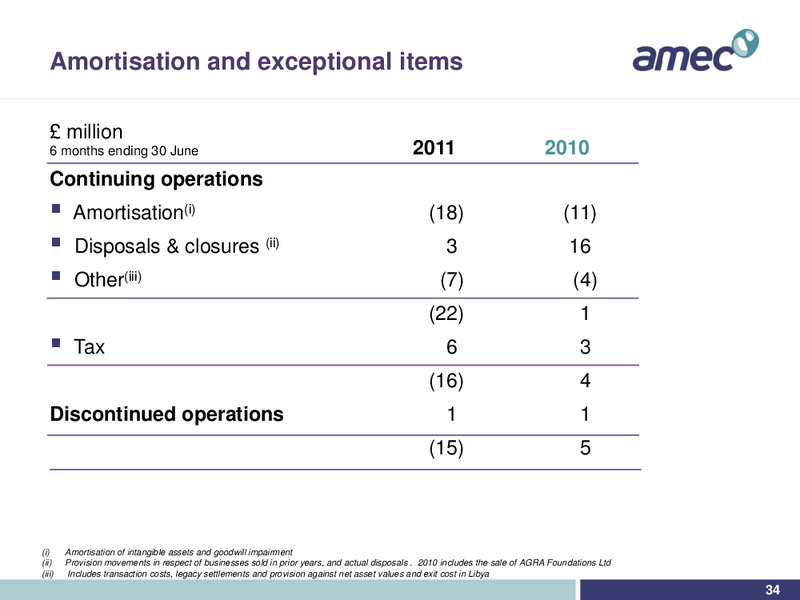
Amortisation and exceptional items million 6 months ending 30 June 2011 2010 Continuing operations Amortisation(i) (18) (11) Disposals & closures (ii) 3 16 Other(iii) (7) (4) (22) 1 Tax 6 3 (16) 4 Discontinued operations 1 1…
Tax rate* million Group 6 months ending 30 June 2011 companies JVs Total EBITA per presentation 109 13 122 Net financing income 7 (3) 4 116 10 126 Tax (28) (3) (31) PAT per consolidated income statement 88 7 95 Tax rate 24.0% 27.0%…
Changes to reporting allocations From 2011 the allocation of certain items on the income statement has been changed UK Asset Support business has transferred from Power & Process to Natural Resources and is reported accordingly…
Changes to reporting allocations Impact on 2010 As reported As restated million Revenue EBITA EBITA % Revenue EBITA EBITA % Natural Resources 1,520.5 174.7 11.5% 1,602.8 178.6 11.1% Power & Process 884.4 75.3 8.5% 802.1 64.8 8.1%…
Changes to reporting allocations H1 2010 impact As reported As restated million Revenue EBITA EBITA % Revenue EBITA EBITA % Natural Resources 730.9 81.1 11.1% 782.5 83.9 10.7% Power & Process 448.0 31.4 7.0% 396.4 25.6 6.5%…
 Loading...