Earnings Presentation First Quarter 2012 May 11, 2012 12:00 noon UK time
Delivered good Q1 2012 results - in line with expectations Good results reflect: - High activity levels in North and Norwegian Seas; higher than typical for first quarter reflecting improving market environment and work delayed from…
Market overview Strong momentum among clients to bring new reserves into production Continue to see growth opportunities in all major markets, albeit at differing paces: - North and Norwegian Seas: Strong activity levels higher…
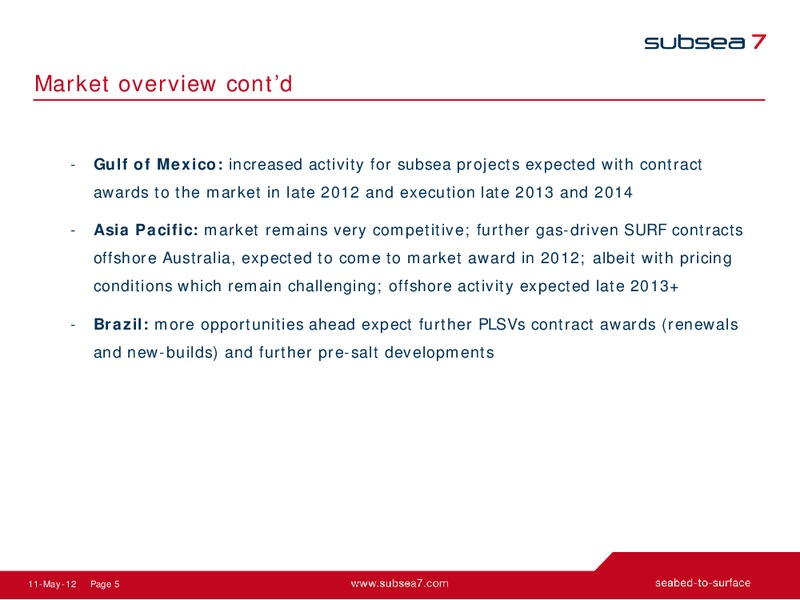
Market overview contd - Gulf of Mexico: increased activity for subsea projects expected with contract awards to the market in late 2012 and execution late 2013 and 2014 - Asia Pacific: market remains very competitive; further…
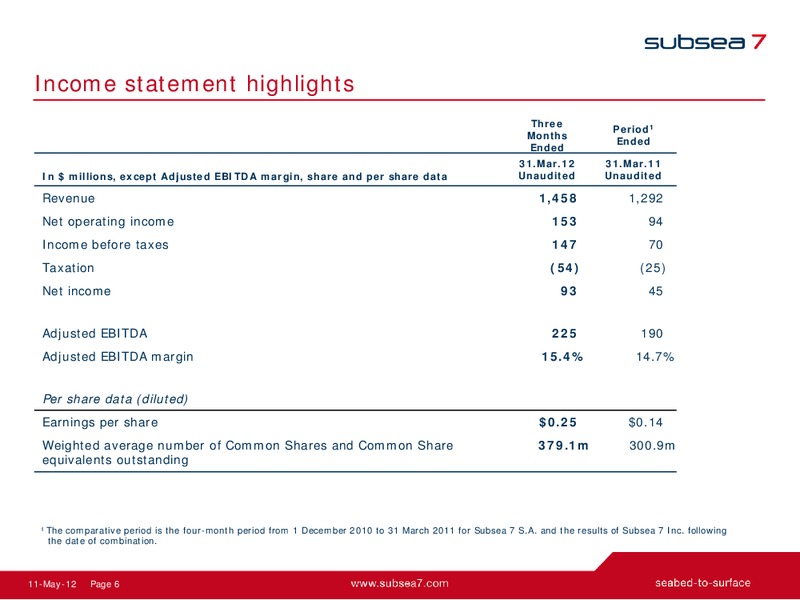
Income statement highlights Three Period1 Months Ended Ended 31.Mar.12 31.Mar.11 In millions, except Adjusted EBITDA margin, share and per share data Unaudited Unaudited Revenue 1,458 1,292 Net operating income 153 94 Income…
Operational performance Q1 2012 578m 308m 308 m 78m (8m) (8m) Revenue Revenue NOI NOI Revenue NOI 528m 86m 3m 308 m 261m Revenue NOI 94m 7m (8m) Revenue NOI Revenue Revenue NOI NOI 11-May-12 Page 7
Income statement highlights contd Three Period1 Months Ended Ended 31.Mar.12 31.Mar.11 In millions Unaudited Unaudited Administrative expenses (91) (110) Share of net income of associates and joint ventures (3) 17 Net…
Cash flow overview Q1 2012 Cash generation from operating activities of 173 million Net cashflows used in investing activities of 127 million reflects capital expenditure of 137 million in line with expectations: Seven Borealis and…
Financial assumptions - 2012 Expect to deliver increased revenue and Adjusted EBITDA in 2012 Joint Venture contribution 2012 lower than 2011 Administrative expenses: c.80 - 85 million per quarter (excluding integration) Final…
2012 expectations Expect to deliver revenue and Adjusted EBITDA for twelve months of 2012 ahead of thirteen month period ended 31 December 2011 Expect increased activity and profitability in NSMC to offset lower activity and…
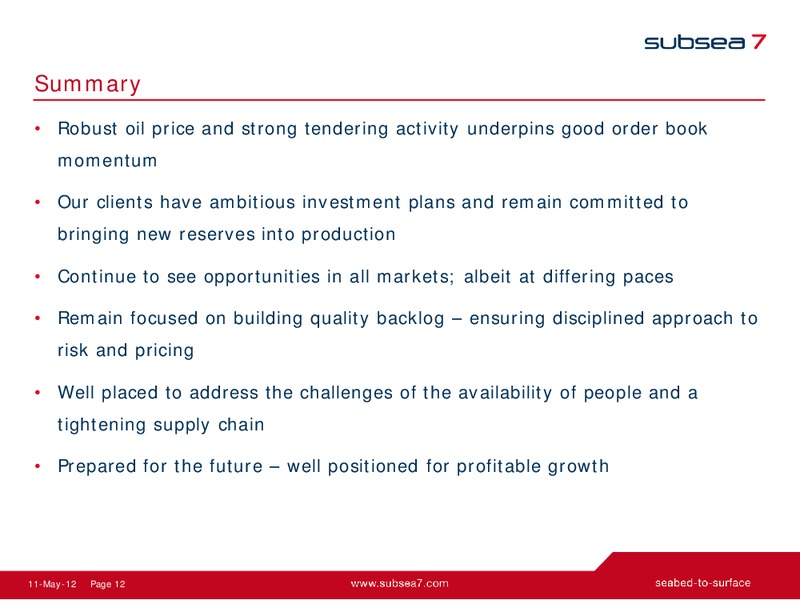
Summary Robust oil price and strong tendering activity underpins good order book momentum Our clients have ambitious investment plans and remain committed to bringing new reserves into production Continue to see opportunities in…
Appendix 11-May-11 2-Nov-11 Page 13
Major project progression Continuing projects 100m between 5% and 95% complete as at 31 March 2012 excl. long-term ship charters and Life-of-Field day-rate contracts. Block 18 GEL (Angola) Oso Re (Nigeria) EGP3B (Nigeria) Block 31…
Backlog In millions as at: 31.Mar.12 31.Dec.11 31.Mar.11 (1) Subsea 7 S.A. 8,686 8,538 6,668 (1) Backlog refers to expected future revenue under signed contracts, which are determined as likely to be performed Backlog by Award…
Segmental analysis: Three months ended Total 31.Mar.12 NSMC AFGoM APME Brazil CORP operations Unaudited In millions Revenue 578.2 528.1 85.6 261.2 4.9 1,458.0 Net operating 77.6 93.8 2.8 6.6 (27.6) 153.2 income/(loss)…
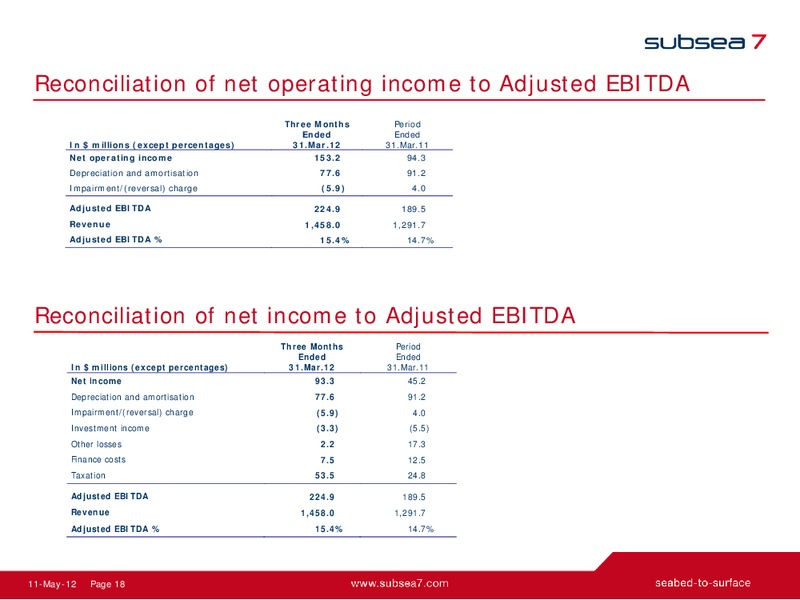
Reconciliation of net operating income to Adjusted EBITDA Three Months Period Ended Ended In millions (except percentages) 31.Mar.12 31.Mar.11 Net operating income 153.2 94.3 Depreciation and amortisation 77.6 91.2…
 Loading...